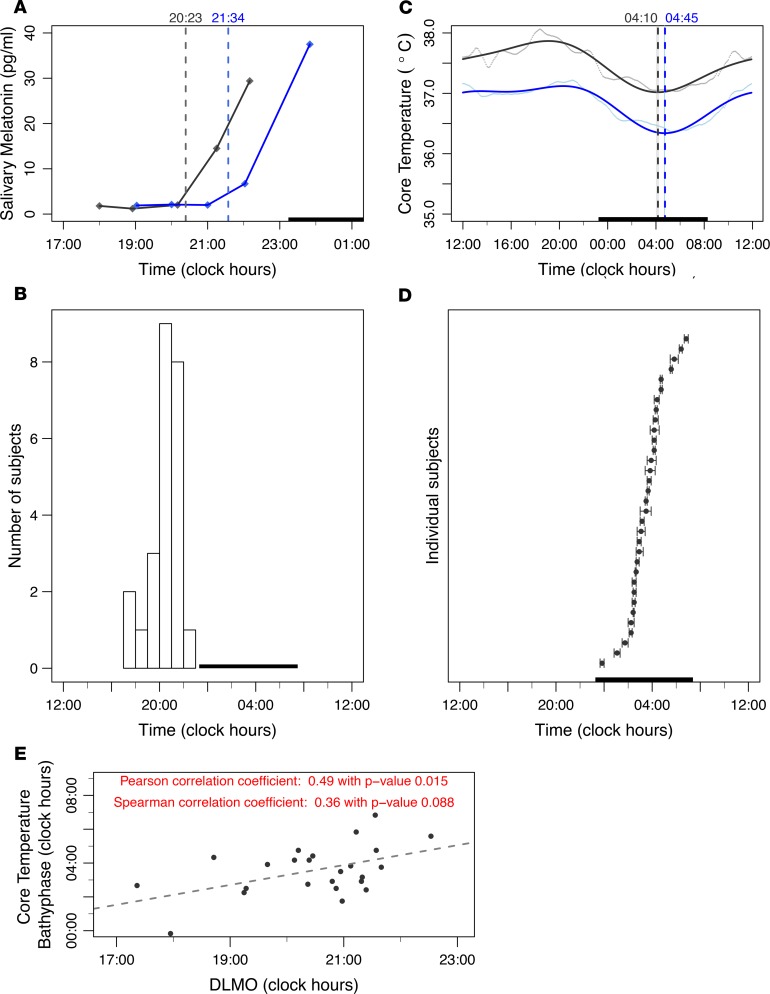
Figure 2. Intersubject variabilities in main circadian biomarkers.
(A) Salivary melatonin profiles in 2 female participants (28 years old shown in gray and 30 years old shown in blue); the vertical dashed lines represent DLMO, which differed by 1 hour and 11 minutes between both subjects. The dark bar represents the mean sleep spans of both participants. (B) DLMO variations among 24 subjects. DLMO could not be computed for 6 participants because of improper or lacking information on sampling times (n = 5) or exposure to light greater than 50 lux within 30 minutes of sampling (n = 1). The dark bar represents the mean sleep span of the 24 participants. (C) Core body temperature patterns in the 2 same participants shown in A. Five-minute aggregated data are displayed as dots; the solid curves illustrate the averaged 24-hour profiles according to 2-harmonic cosinor fitting. Bathyphases with 90% CIs estimated by the bootstrap method are indicated with dashed lines and color bands. The dark bar represents the mean sleep span of both participants. (D) Core body temperature bathyphase (and 90% CI) variations among the 33 participants. The dark bar represents the mean sleep span of all participants. (E) Scatter plots and dashed regression line, with results from both Pearson’s and Spearman’s correlations between DLMO and core body temperature bathyphase for the 24 subjects.

