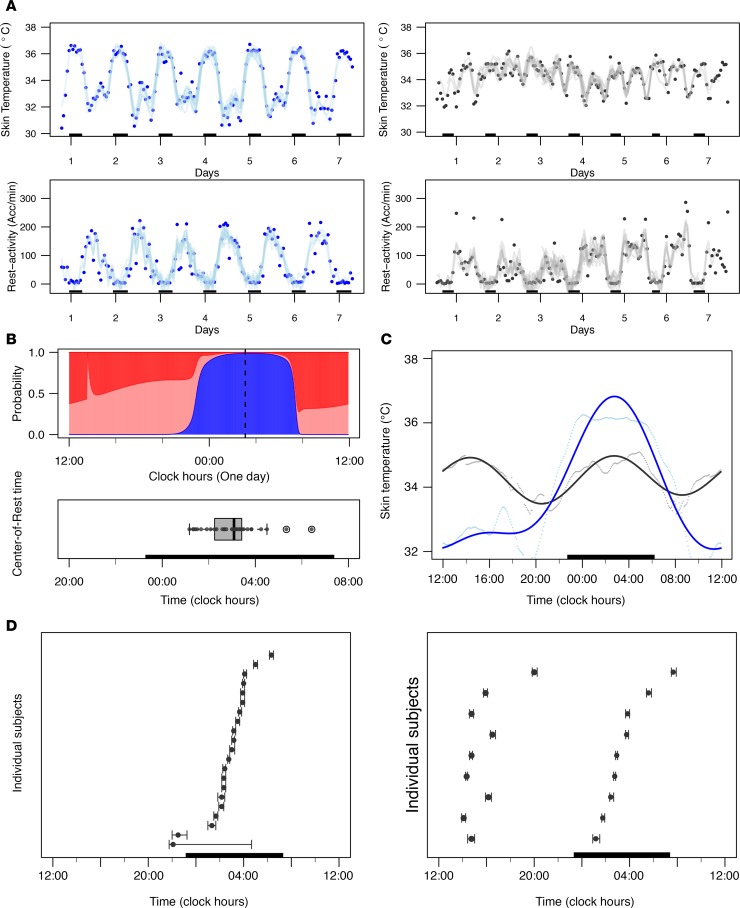
Figure 3. Intersubject variabilities in rest-activity and chest surface temperature.
(A) Representative examples of chronograms of chest surface temperature (top) and rest-activity (bottom) of 2 participants (blue represents a female, 71 years old; gray, a male, 34 years old). Hourly aggregated data are shown with dots, with solid curves corresponding to Fourier fitting with harmonics estimated using Spectrum Resampling algorithm (28). The dark bars represent the participants’ respective sleeping spans. (B) Top: Circadian activity state probability plot from harmonic HMM for a 78-year-old male participant illustrating the computation method of the center-of-rest time. Three activity states were assumed in the HMM, i.e., inactive state (blue), moderately active state (pink), and highly active state (red). The 3 states’ probabilities sum up to 1. The center-of-rest time was computed as the gravity center of the inactive state probability profile (blue), as indicated with a dashed, vertical black line. Bottom: Box plot (5th–95th percentiles) of the center-of-rest times in the 33 participants. The dark bar represents the mean sleep span of all 33 participants. (C) Representative examples of the chest surface temperature of the same participants as in A. Five-minute aggregated data are shown as dots, and solid curves represent the averaged 24-hour profiles using cosinor fitting. The dark bar represents the mean sleep span of both participants. (D) Range of chest surface temperature acrophases (and 90% confidence limits estimated by bootstrap method) of the 24 participants displaying a 24-hour rhythm (left) and the 9 participants with a dominant 12-hour rhythm (right). The dark bar represents the mean sleep span of the corresponding participants.

