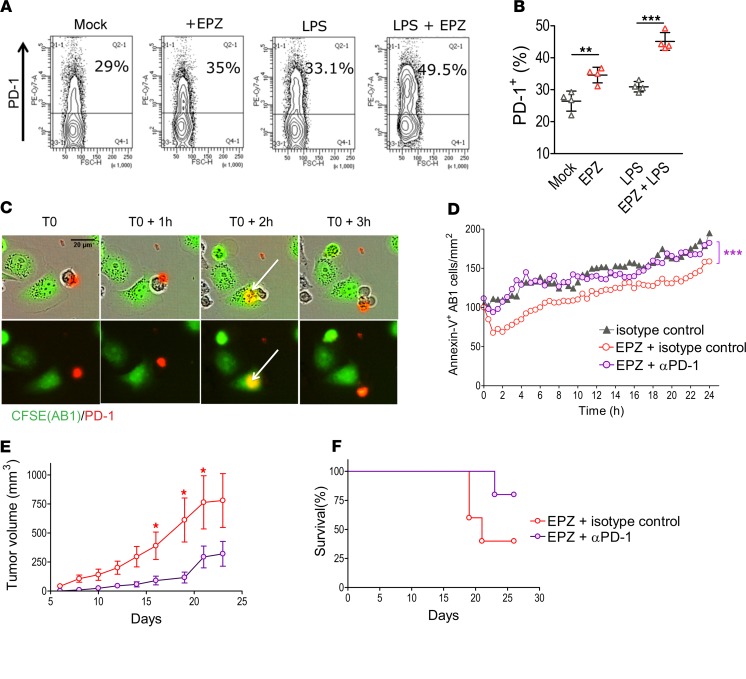
Figure 6. Effect of EPZ on PD-1 expression and activity of anti–PD-1 blockade in AB1/RAW264.7 cocultures.
(A) RAW264.7 macrophages were cultured in the presence of LPS and/or EPZ as described in Figure 3. After labeling with an anti–mouse PD-1 antibody, fluorescence emission was analyzed by flow cytometry using a BD FACSAria. Representative dot plots of FSC-H (x axis) and percentage of PD-1 cells (y axis) are shown. (B) Percentages of RAW264.7 macrophages expressing PD-1 were deduced from 4 independent experiments. Each bar represents the mean ± SD. **P < 0.01, and ***P < 0.001, calculated using 1-way ANOVA followed by Tukey’s multiple-comparisons test. (C) Time-lapse analysis of CFSE-labeled AB1 cells cocultured with RAW264.7 macrophages for 24 hours at a 1:1 ratio in the presence of PE/Cy7–conjugated anti–mouse PD-1 antibody (red). (D) RAW264.7 macrophages were incubated with anti–PD-1 antibody (10 μg/mL; InVivoMAb, BioXcell) or rat IgG2a isotype control for 6 hours and then cocultivated with CFSE-labeled AB1 cells in the presence of annexin V-APC. The cells were monitored by the IncuCyte S3 Live-Cell imaging system (Essen Bioscience) placed in an incubator maintained at 37°C in a humidified 5% CO2 atmosphere. The number of annexin V+ AB1 cells (percentage) was quantified every 10 minutes for 24 hours. Statistical significance was evaluated using 2-way ANOVA with Bonferroni’s post test. ***P < 0.001. (E) RAW264.7 macrophages were cultured with the EZH2 inhibitor (10 μM EPZ5687) for 24 hours and with anti–PD-1 antibody (10 μg/mL; InVivoMAb, BioXcell) or Rat IgG2a isotype control (10 μg/mL, BD) for 6 hours before inoculation. After 3 washes, RAW264.7 macrophages were coimplanted SC into BALB/c mice with 2 × 10⁶ AB1 or AB12 cells at a 1:3 ratio. Tumor volumes (in mm3) were calculated weekly using the following formula: 4/3 × π × (diameter/2)3. (F) The corresponding survival curve for E. Groups of at least 6 mice were tested in each experimental condition. All data are plotted as mean ± SEM (n = 6). Statistical significance was evaluated using 2-way ANOVA with Bonferroni’s post test (E) and log-rank χ2 test (F). *P < 0.05; **P < 0.01; ***P < 0.001.

