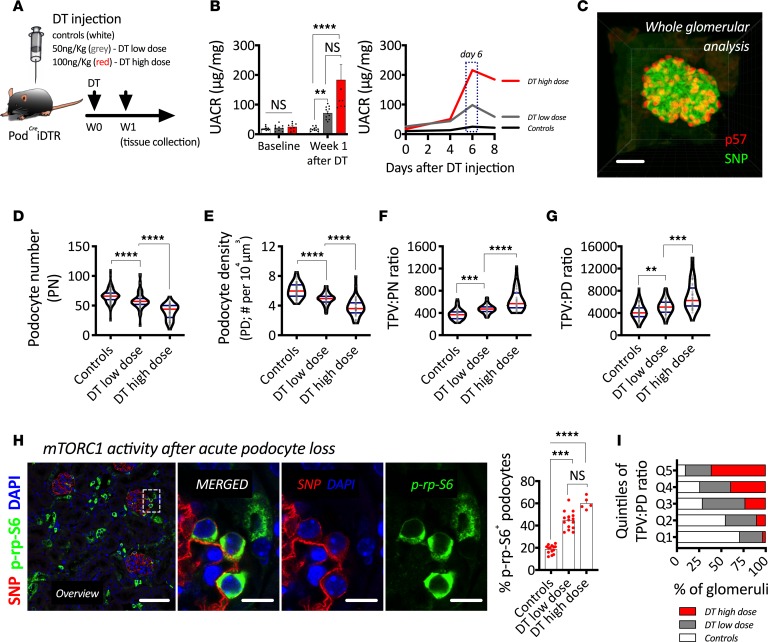
Figure 2. mTOR-mediated podocyte hypertrophy during acute podocyte loss.
(A) Schematic representation of experimental design. (B) Urinary albumin to creatinine ratio (UACR); on the left, we show average per time point, and on the right, the evolution every 2 days per group. (C) Three-dimensional reconstruction of an intact mouse glomerulus after indirect immunofluorescence, solvent-based optical clearing, and confocal microscopy showing double labeling of podocytes with p57 (red) and synaptopodin (SNP, green). (D) Podocyte number. (E) Podocyte density. (F) Total podocyte volume per unit of podocyte number (TPV:PN ratio). (G) Total podocyte volume per unit of podocyte density (TPV:PD ratio). (H) Representative confocal image showing indirect immunofluorescence of a podocyte marker (SNP, red) and a downstream target of mTORC1 (phosphorylated ribosomal protein S6, p-rp-S6 in green) and quantification of the percentage of p-rp-S6–positive podocytes per group. (I) Quintile analysis of TPV:PD. ****P < 0.0001; ***P < 0.001; **P < 0.01. In B, bars represent means and error bars ± SEMs. In violin plots, red lines represent medians and blue lines represent IQRs; every gray dot represents 1 glomerulus. Kruskal-Wallis with Dunn’s multiple comparisons tests were used. Scale bars: (C) 30 μm, (H overview) 70 μm, and (H panels) 10 μm.

