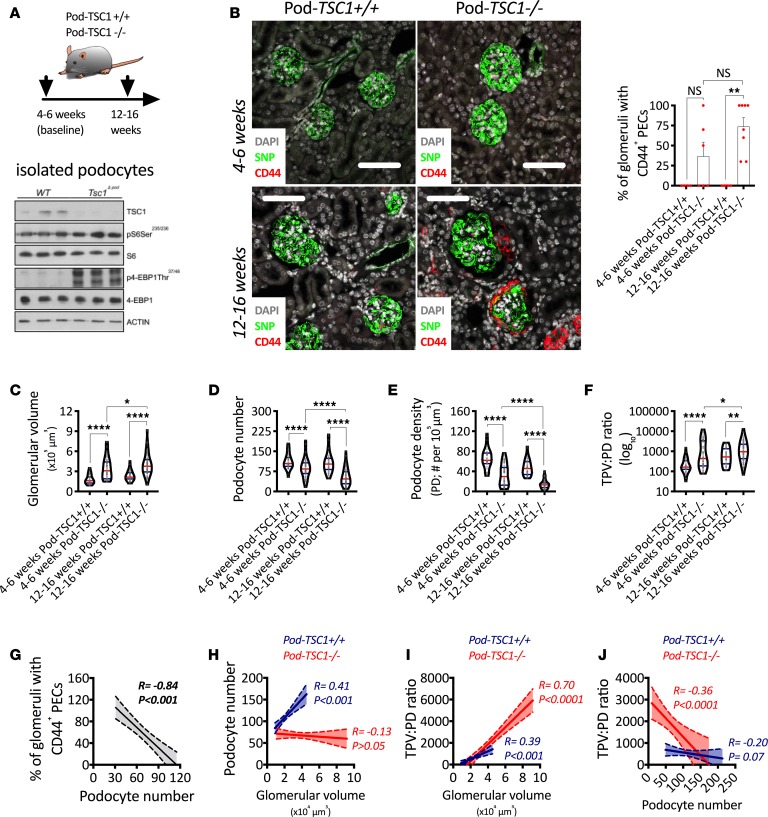
Figure 6. mTORC1 hyperactivation in podocytes leads to podocyte loss and PEC activation.
(A) Schematic representation of experimental design and validation of tuberous sclerosis complex 1–KO (TSC1-KO) in isolated podocytes. (B) Representative confocal images after indirect immunofluorescence for a podocyte specific marker (Synaptopodin, SNP) and a PEC activation marker (CD44) combined with the percentage of glomeruli with CD44+ PECs. (C) Glomerular volume. (D) Podocyte number. (E) Podocyte density. (F) Total podocyte volume per unit of podocyte density (TPV:PD ratio). (G) Associations between percentage of glomeruli with CD44+ PECs and podocyte number. (H) Associations between podocyte number and glomerular volume. (I) Associations between TPV:PD and glomerular volume. (J) Associations between TPV:PD and podocyte number. ****P < 0.0001; **P < 0.01; *P < 0.05. In B, bars represent means and error bars ± SEMs. Each dot represents 1 mouse. In violin plots, red lines represent medians and blue lines represent IQRs; every gray dot represents 1 glomerulus. Kruskal-Wallis with Dunn’s multiple comparisons tests were used. In correlation analyses (Spearman’s rank coefficients), solid lines represent the regression line and dotted lines the 95% CI. Scale bars: 80 μm.

