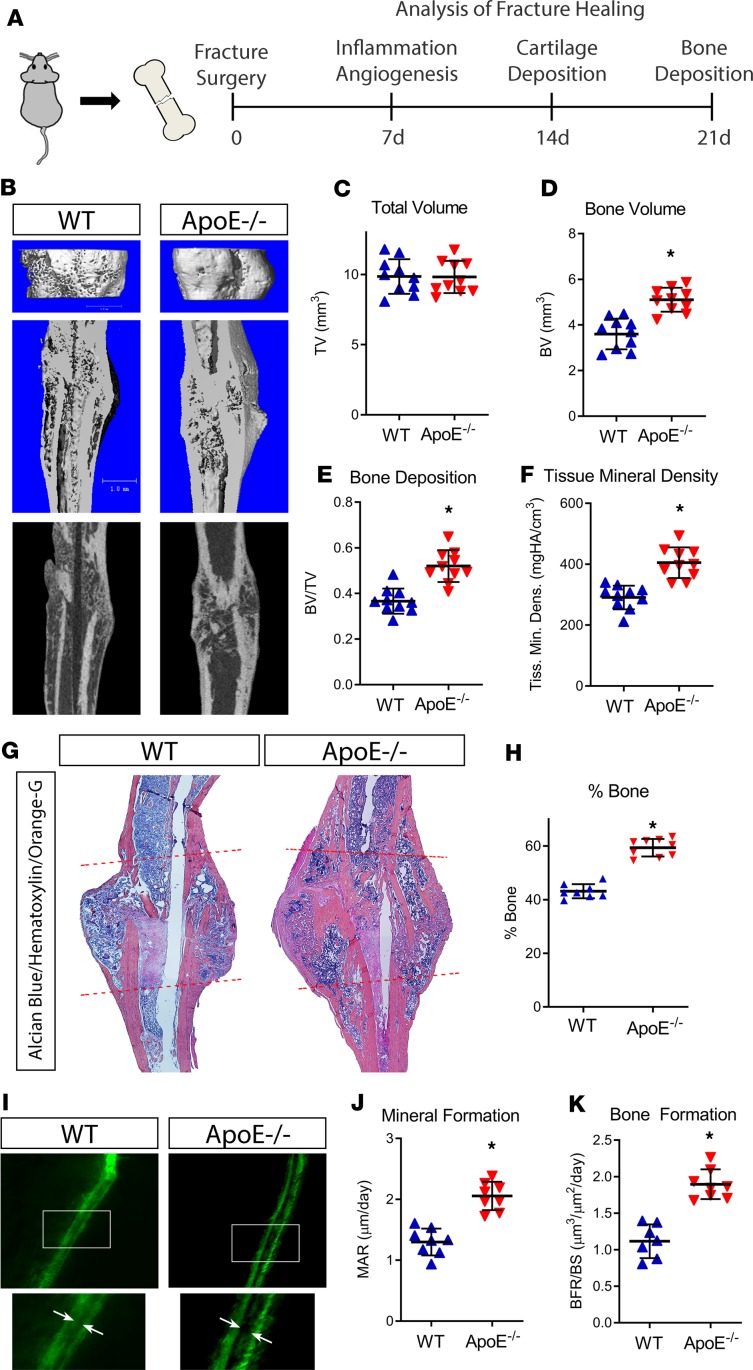
Figure 1. Loss of ApoE increases bone deposition during late stages of bone fracture healing.
(A) Schematic diagram of tibial fracture model and subsequent assessment of repair. WT and ApoE–/– mice underwent tibial surgery, and fracture calluses were analyzed 7, 14, and 21 days after injury. (B) Using μCT, 21-day fracture calluses were assessed to determine (C) total callus volume (TV), (D) bone volume (BV), (E) bone content (BV/TV), and (F) tissue mineral density. Scale bar: 1 mm. (G) Histological staining with Alcian blue/hematoxylin/Orange G was used to visualize decalcified tissue (fracture callus region is indicated by dashed lines). (H) Histomorphometric analysis was used to quantify the amount of new bone within the fracture site and related to the total callus size. (I) Calcein double labeling (white arrows) was used to investigate the (J) mineral apposition rate (MAR) and (K) bone formation rate relative to the bone surface (BFR/BS). For μCT, histology, and histomorphometry, WT, n = 10; ApoE–/–, n = 10. For calcein labeling, WT, n = 8; ApoE–/–, n = 8. Data are expressed as mean ± 95% confidence interval. *P < 0.05, 2-tailed t test.

