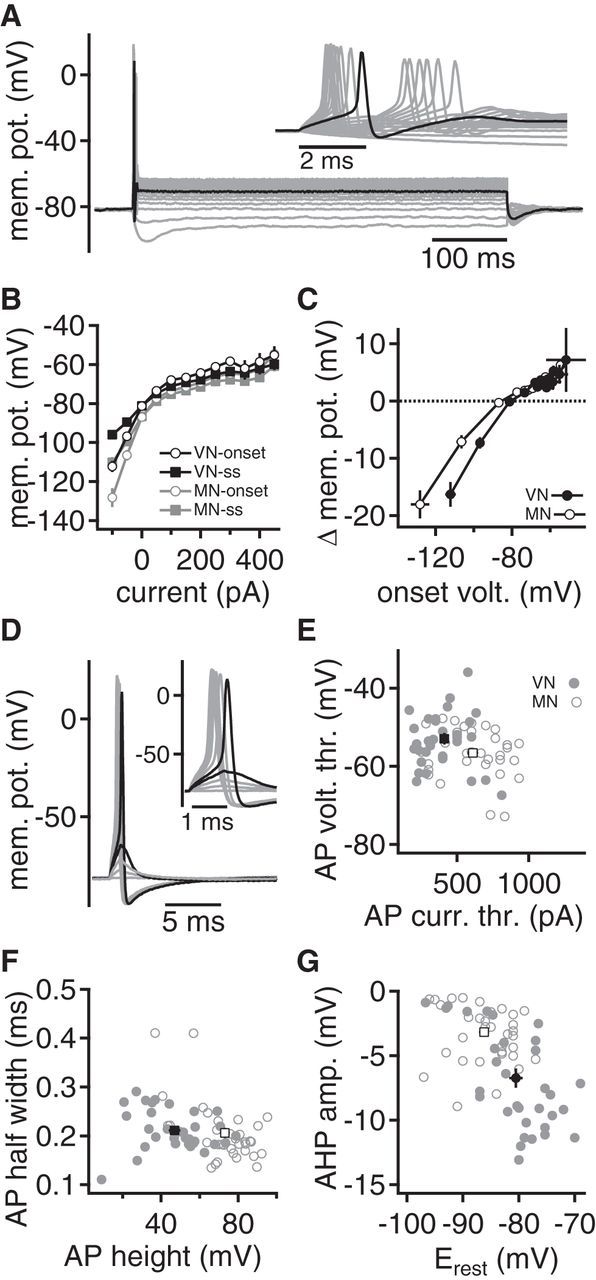
Figure 2.

Presynaptic excitability of endbulbs in the VNLL and MNTB. A, Voltage responses to 500 ms hyperpolarizing and depolarizing current injections in an endbulb in the VNLL. Inset, Onset of voltage response. First suprathreshold voltage response is given in black. Five of 17 endbulbs in the VNLL responded with an AP doublet during current injections. B, Onset and steady-state voltage-current relationships in the endbulb in the VNLL (black) and the calyx of Held (gray). Onset voltage (open symbols) was calculated at the maximal hyperpolarization after the AP firing. Steady-state (ss) response was extracted at the end of the current injection. C, Difference between onset and steady-state voltage response (Δmem. pot.) as a function of the onset voltage. Closed symbols represent endbulbs in the VNLL, and open symbols represent calyx of Held recordings. D, A brief, 1 ms current injection of increasing strength elicited subthreshold and suprathreshold responses in an endbulb in the VNLL. Last subthreshold and first suprathreshold responses are shown in black. Inset, Magnification of the time of AP generation. E, The AP voltage threshold is given as a function of AP current threshold. Closed symbols represent single recordings from endbulbs in the VNLL, and open symbols represent calyx of Held recordings. Black square symbols represent the respective average values. F, The AP half-width is given as a function of AP height. Symbols as in E. G, The AP after-hyperpolarization given as a function of membrane potential. Symbols as in E.
