Figure 3.

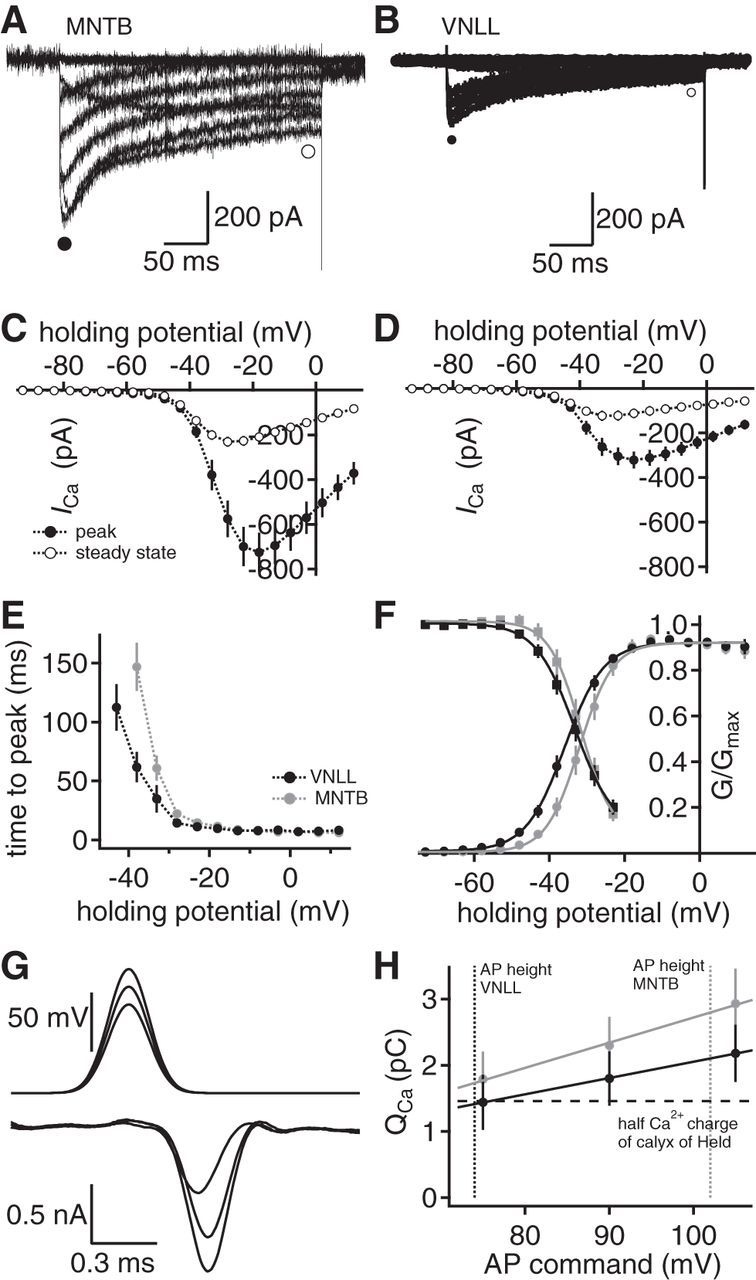
Activation and scaling of presynaptic calcium currents. A, B, Whole-cell calcium currents from a calyx of Held (A) and an endbulb in the VNLL (B). Closed circles represent the peak current, and open circles represent the regions at which the size of the steady-state currents was extracted. C, D, Current–voltage relationships in calyx of Held (C) and the endbulb in the VNLL (D). Closed symbols represent peak currents; open symbols represent steady-state values. E, Voltage-dependent activation time of calcium currents (calyx of Held, n = 21; endbulbs in the VNLL, n = 18). F, Voltage-dependent activation and inactivation of calcium currents in the calyx of Held (gray) and the endbulb in the VNLL (black). Lines indicate sigmoid fits. G, Presynaptic calcium current (bottom) evoked by AP waveforms of different height (top) in an endbulb in the VNLL. H, Average calcium current charge at different AP waveform commands in the endbulb in the VNLL (black symbols, n = 6) and the calyx of Held (gray solid symbols, n = 8). Dotted vertical lines indicate the average AP height in the endbulb in the VNLL (black) and the calyx of Held (gray). Horizontal dotted line indicates half of the calcium current charge of the calyx of Held.
