Figure 6.

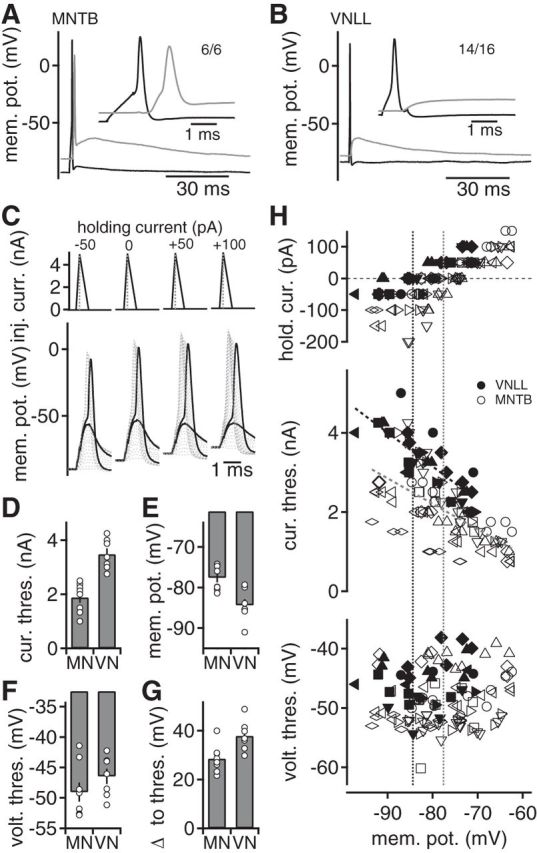
Postsynaptic excitability controls synaptic information transfer. A, B, Simultaneous presynaptic (black) and postsynaptic (gray) current-clamp recordings from calyx of Held (A) and endbulb synapses in the VNLL (B). Presynaptically evoked APs trigger postsynaptic voltage responses. Inset, presynaptic and postsynaptic response. A, Numbers indicate cells that responded with a postsynaptic AP upon a presynaptic AP. B, Numbers indicate the cells that showed no reliable AP transfer. C, Postsynaptic current injections approximating EPSC waveforms were used to assay the current and voltage thresholds for APs at different offset holding currents. Top, Dotted lines indicate the successive increase in the peak current injection. Subthreshold and suprathreshold voltage responses of simulated EPSCs (bottom) in a VNLL neuron. D, Postsynaptic current threshold of AP generation of simulated EPSC current injections in VNLL (VN) (n = 7) and MNTB (MN) (n = 8) neurons at 0 pA holding current. E, Resting membrane potential of VNLL and MNTB neurons. F, Postsynaptic voltage threshold of APs generated by injection of simulated EPSCs in the VNLL and the MNTB. G, Difference between resting potential and voltage threshold for AP generation in VNLL and MNTB neurons at 0 pA holding current. H, Current (middle) and voltage (bottom) threshold for the first suprathreshold response at different holding currents (top) as a function of the holding potential. Different symbols represent different cells. Closed symbols represent VNLL, and open symbols represent MNTB neurons. Dotted lines at the current threshold represent linear fits. Vertical dotted lines indicate the cell's average membrane potential.
