
Figure 10.
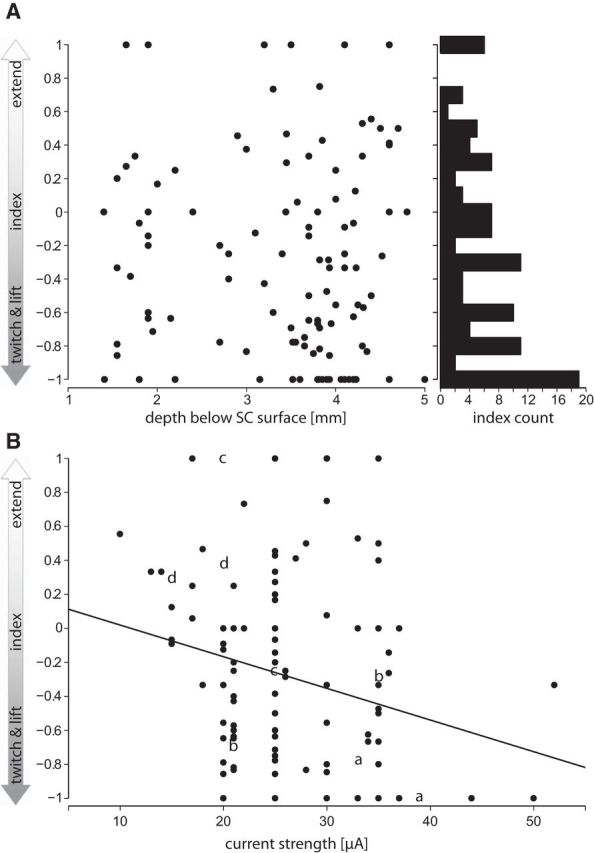
A, Depth distribution of an index specifying the ratio between the frequencies of twitch and lift and of extend movements elicited by electrical microstimulation at the same stimulation site in the superior colliculus. y-axis, Twitch and lift or extend index; −1 = only twitch and lift; +1 = only extend movements; 0 = twitch and lift and extend movements with equal probability. Left x-axis, Depth below surface of the SC; right x-axis, frequency of indices in 0.1 bins. B, Influence of microstimulation current strength (plotted along the x-axis) on the likelyhood to elicit twitch and lift or extend movements (index as specified in A plotted along the y-axis). Letters indicate four examples with two different current strengths applied at the same stimulation site.