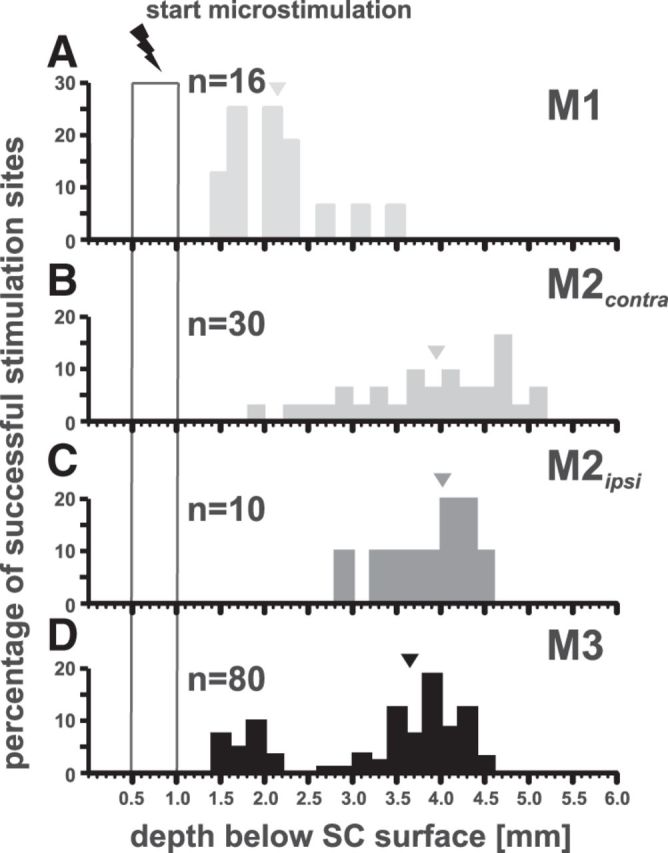
Figure 11.

Histograms showing the percentage of effective microstimulation sites (200 μm bins) plotted versus depth (mm) below the collicular surface for monkey M1 (A, light gray); for monkey M2 [contralaterally vs ispsilaterally elicited arm movements in gray (B) and dark gray (C), respectively], and for monkey M3 in black (D). Triangles represent the median depths of effective stimulation sites (M1: 2150 μm; M2, contralateral: 3980 μm, ipsilateral: 4000 μm; M3: 3650 μm). Open rectangle from 0.5 to 1 mm represents the depth range where electrical probing started.
