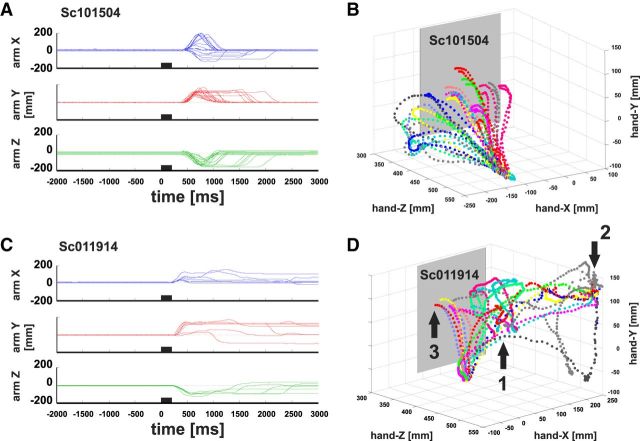
Figure 2.
Example trajectories for monkey M1 and M3. A, Typical arm positions for monkey M1. X, Y, and Z coordinates of the arm position (mm] are plotted on the y-axes over time (ms) on the x-axis. All traces are aligned to microstimulation onset (time = 0). Black bars on the x-axis represent the start and end of the applied microstimulation. Plotted is the change in position with respect to the pre-stimulation period (mm = 0). B, Illustration of the same trajectories in three dimensions during the first 2000 ms after stimulation onset. The workspace is defined as follows: x-axis runs horizontally, y-axis vertically parallel to the screen, and the z-axis describes the depth (i.e., the distance between the monkey and the screen). The origin of the coordinate system is represented by the magnetic field source behind the screen. C, shows the X, Y, and Z positions for typical arm movements of monkey M3. D, Corresponding three-dimensional illustrations for M3 with the same conventions as in A and B. See main text for a more detailed description.

