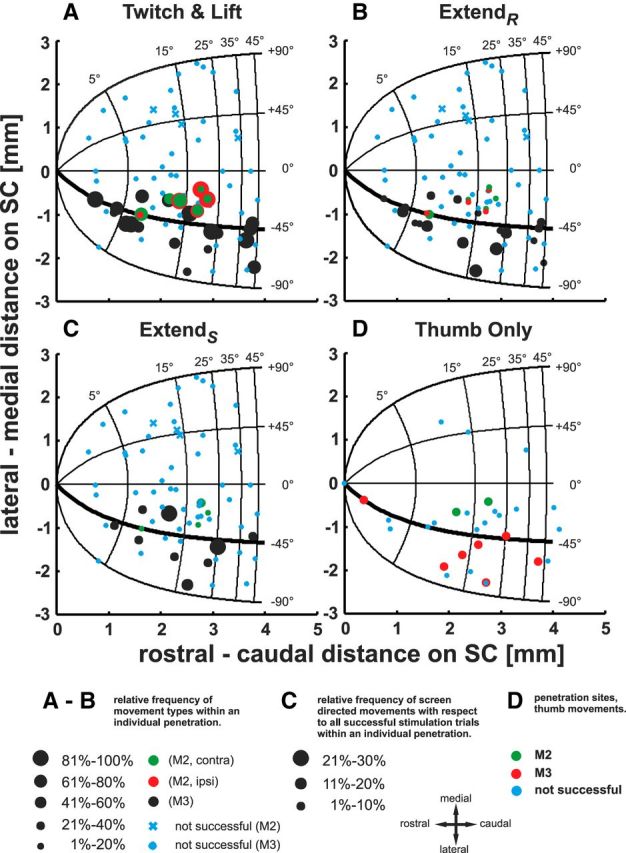
Figure 9.

Distribution of relative frequencies of successful microstimulations plotted on the collicular motor map. The collicular oculomotor map (degree) is presented in Cartesian coordinates (mm), with its origin representing the rostral pole of the SC. Iso-amplitude lines are running vertically in mediolateral direction and isodirectional lines horizontally in rostrocaudal direction. A–C, Relative frequencies of successful microstimulations for movement types “twitch+lift,” extendR, and extendS, respectively. Black dots represent penetrations where arm movements could be elicited in M3; green and red dots correspond to penetration sites eliciting movements of the contralateral and ipsilateral arm, respectively, in M2. Size of dots is scaled to the relative frequency of the movement type with respect to all successful microstimulations within the corresponding penetration (see bottom of figure). Blue crosses and dots demarcate ineffective microstimulation sites in monkey M2 and M3, respectively. D, Green and red dots correspond to locations where thumb movements could be elicited in M2 and M3, respectively.
