Figure 1.

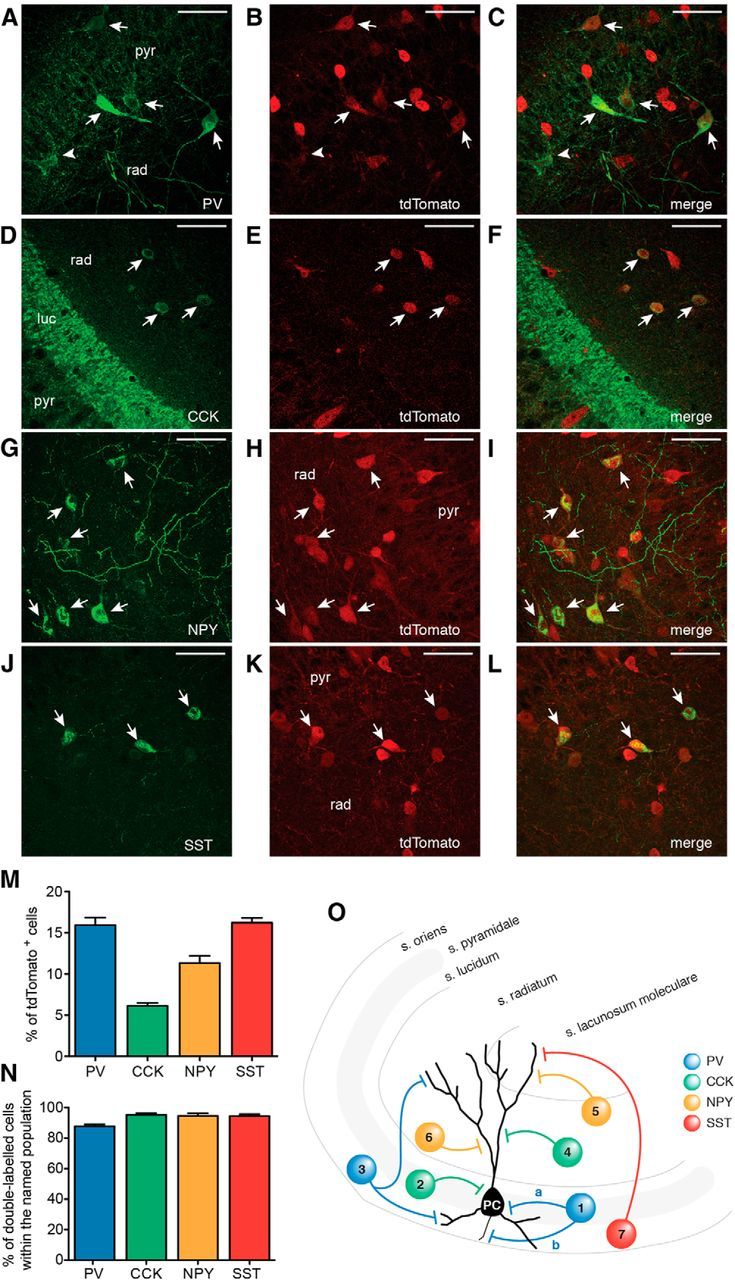
Gad2 interneurons encompass several subpopulations of inhibitory cells. A–L, Confocal stacks of slices from Gad-Cre::Ai14 mice immunostained against tdTomato (A, D, G, J) and PV (B), CCK (E), NPY (H), and SST (K). Merged images are shown in C, F, I, and L, respectively. Arrows indicate cells double-labeled for respective markers and tdTomato. A, B, Arrowhead indicates a cell positive for PV but negative for tdTomato. Scale bars, 50 μm. pyr, Stratum pyramidale; rad, stratum radiatum; luc, stratum lucidum. M, Bar graph showing the percentage of cells positive for the respective marker out of the total number of tdTomato cells in the CA3 area of the hippocampus. N, Bar graph showing the percentage of double-labeled cells (respective marker and tdTomato) within the total number of PV, CCK, NPY, and SST cells. M, N, Data were obtained from total of 15 slices from 2 animals for each marker (total number of tdTomato-positive cells, n = 10,473). O, Schematic illustration indicating the locations and subcellular targets of inhibitory interneurons expressing the markers used. 1a and 2, basket cells; 1b, axo-axonic or chandelier cell; 3, bistratified cell; 4, Schaffer-collateral associated cell; 5, neurogliaform cell; 6, ivy cell; 7, oriens-lacunosum moleculare cell. Blue represents PV; green, CCK; yellow, NPY; red, SST. Values represent mean ± SEM.
