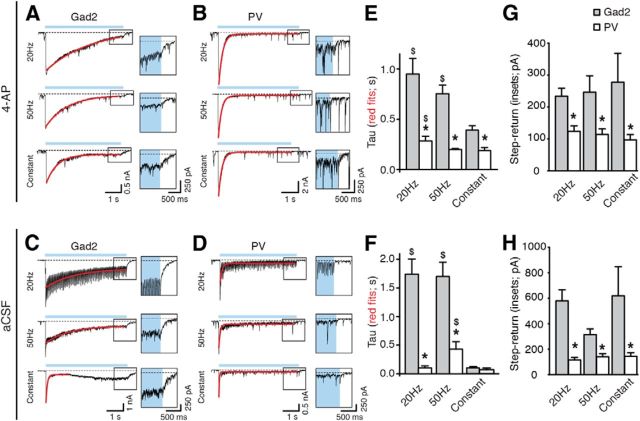
Figure 10.
Longer decay time of light-induced currents in CA3 pyramidal cells in Gad2 compared with PV mice. A–D, Whole-cell recordings of CA3 pyramidal neurons in 4-AP ACSF (A, B) or normal aCSF (C,D), showing the inward current induced by light activation of Gad2 (A, C) or PV (B,D) interneurons. Blue line indicates the period of light illumination. Dashed line indicates the baseline. Single exponential fit to the current decay is shown in red. Note the current step at blue light termination in the expanded boxes on the right. E, F, Comparison between the time constant τ of the decay for the inward current recorded in CA3 pyramidal neurons upon activation of Gad2 or PV interneurons in 4-AP aCSF (E; Gad2, n = 24 illuminations from 12 experiments; PV, n = 23 and 24 illuminations from 12 experiments for 20 and 50 Hz, n = 14 from 7 experiments for constant) or normal aCSF (F; Gad2, n = 5 illuminations from 5 experiments; PV, n = 12 illuminations from 12 experiments). *Statistically significant difference between the τ for Gad2 and PV mice. Kruskal–Wallis test (p < 0.0001), Dunn's multiple-comparison test (p < 0.01) for 4-AP aCSF. One-way ANOVA (p < 0.01), Bonferroni's multiple-comparison test (p < 0.001) for normal aCSF. $Statistically significant difference between the τ in Gad2 or PV mice during constant light versus 20 Hz or 50 Hz illumination paradigms. Kruskal–Wallis test (p < 0.05), Dunn's multiple-comparison test (p < 0.05) for 4-AP aCSF and PV-mice in aCSF. One-way ANOVA (p = 0.0002), Bonferroni's multiple-comparison test (p < 0.001) for Gad-mice in aCSF. G, H, Comparison between the step-return to baseline current recorded in CA3 pyramidal cells at the end of light stimulation, in 4-AP aCSF (G; Gad2, n = 20 illuminations from 10 experiments for 20 and 50 Hz, n = 18 illuminations from 9 experiments for constant; PV, n = 18 illuminations from 9 experiments for 20 Hz, n = 20 illuminations from 9 experiments for 50 Hz and n = 15 illuminations from 8 experiments for constant) and normal aCSF (H; Gad2, n = 5 illuminations from 5 experiments; PV, n = 12 illuminations from 12 experiments.*Statistically significant difference between the measured current after Gad2 versus PV interneuron stimulation. Mann–Whitney U test and unpaired t test for experiments performed in 4-AP and normal aCSF, respectively (p < 0.05), in all cases. Values represent mean ± SEM.

