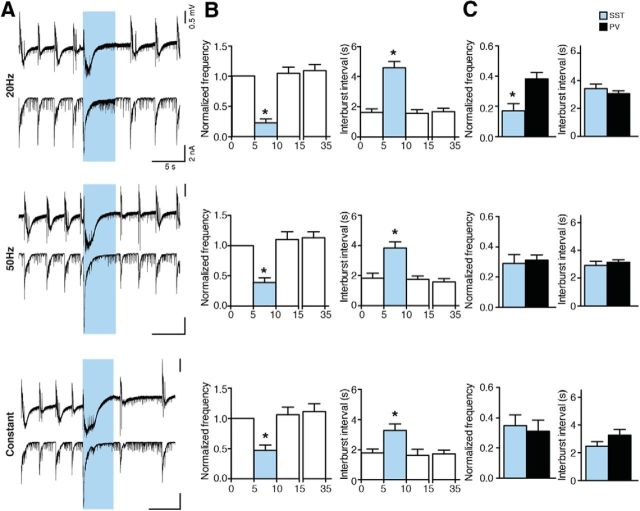
Figure 12.
Activation of SST interneurons suppresses epileptiform activity. A, Field recordings from the CA3 region (top) and simultaneous whole-cell recordings from CA3 pyramidal neurons (bottom) showing the effect of different illumination paradigms on epileptiform activity. Blue shading represents illumination. B, Bar charts of averaged data (n = 18 illuminations in 9 slices for 20 Hz and 50 Hz, and n = 16 illuminations in 8 slices for constant). Blue bars represent light period. *Statistical difference between the light and all nonlight periods. Friedman test (p < 0.0001) and Dunn's multiple-comparison test (p < 0.01) for all illuminations, except for 20 Hz interburst interval where repeated-measures ANOVA (p < 0.0001) followed by Bonferroni's multiple-comparisons test (p < 0.0001 were used). C, Comparison of effects of illumination on bursting between SST- and PV-Cre mice. *p < 0.05, significant difference (unpaired t test).

