Figure 2.
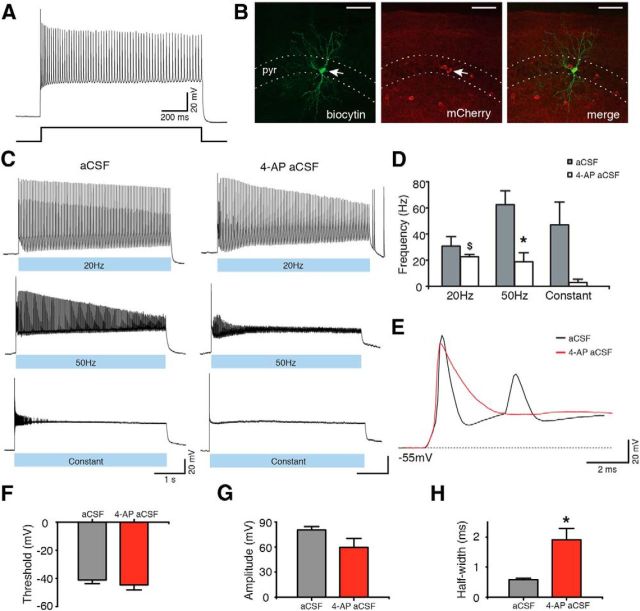
ChR2-expressing Gad2 interneurons generate APs upon blue light illumination. A, Whole-cell current-clamp recording (top) of a Gad2 interneuron generating a train of APs upon sustained 500 pA current injection (bottom). B, Confocal stack image showing biocytin (left) and mCherry (middle) staining of the Gad2 interneuron shown in A. Merged image is shown on the right. Scale bars, 50 μm. pyr, Stratum pyramidale. C, Same cell as in A generating APs during 20 Hz, 50 Hz, or constant blue light illumination for 5 s, in aCSF (left) and in 4-AP aCSF (right). D, Bar chart of average data from experiments shown in C (n = 5 cells for aCSF and n = 6 cells for 4-AP aCSF). *Statistical significance between the firing frequency in aCSF and 4-AP aCSF: Wilcoxon matched-pairs signed-ranks test (p = 0.031). $Significant difference between the firing frequency during 20 Hz and constant light illumination in 4-AP aCSF: Kruskal–Wallis test (p = 0.012), Dunn's multiple-comparison test (p < 0.05). E, First APs induced by 20 Hz blue light illumination in aCSF (black) and in 4-AP aCSF (red). F–H, Average parameters of the first APs induced by 20 Hz blue light illumination in the presence of aCSF (gray bar, n = 6 cells) or 4-AP aCSF (red bar, n = 6 cells). *Statistical significance between the two experimental conditions: paired t test. F, AP threshold (p = 0.216). G, AP amplitude (p = 0.110). H, AP half-width (p = 0.012). Values represent mean ± SEM.

