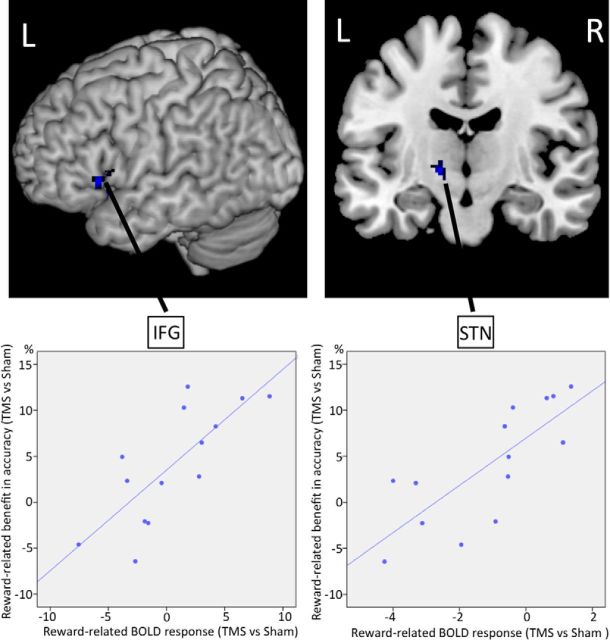
Figure 2.
fMRI covariance analysis. Regions showing significant correlation with individual differences in the reward-related benefit in accuracy. For illustration purposes only, the SPM is thresholded at Puncorrected < 0.005 and the rTMS-induced behavioral benefit is plotted against the rTMS-induced change in neural activity of, respectively, left IFG (ρ: 0.769) and left STN (ρ: 0.776). L, left; R, right.

