Figure 1.

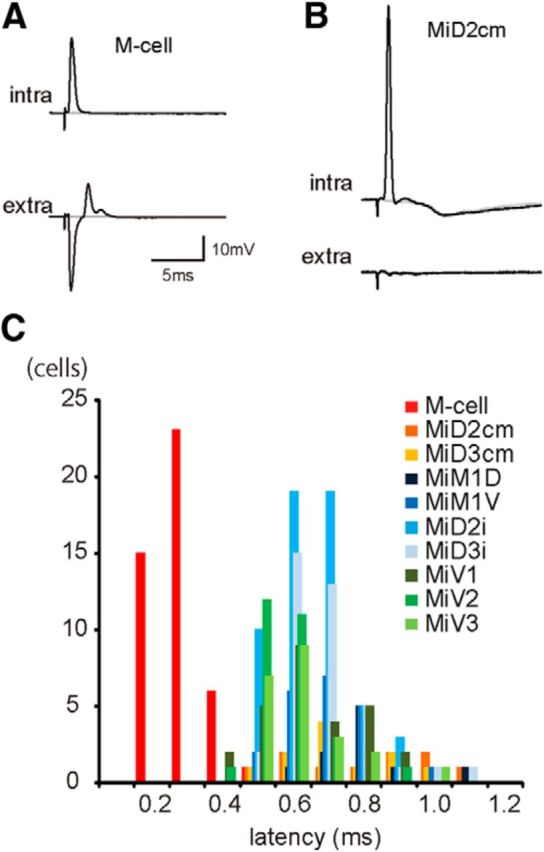
Electrophysiological identification of reticulospinal neurons in r4–r6. A, B, Antidromically evoked AP in the M-cell (A) and a MiD2cm cell (B). Top traces are intracellularly recorded APs (intra) that occurred in response to spinal cord stimulation at threshold intensities, and APs were observed in an all-or-nothing manner. Corresponding extracellular (extra) field potentials are shown below. Failures are represented by gray traces. Resting membrane potential (Erest) was −80 mV in both the M-cell and MiD2cm cell. The calibration in A is also applicable to B. C, Frequency distribution of the onset latencies of antidromic spikes from spinal stimulation. The latencies of the M-cells (red) were distinctively shorter than those of other RSNs (p < 0.001, Mann–Whitney U test): 0.29 ± 0.01 ms (mean ± SEM; range, 0.16–0.48; n = 45) in the M-cell, 0.68 ± 0.03 ms (n = 22) in MiD2cm, 0.58 ± 0.02 ms (n = 28) in MiD3cm, 0.82 ± 0.06 ms (n = 10) in MiM1D, 0.73 ± 0.04 ms (n = 11) in MiM1V, 0.64 ± 0.01 ms (n = 56) in MiD2i, 0.62 ± 0.03 ms (n = 22) in MiD3i, 0.81 ± 0.04 ms (n = 10) in MiV1, 0.63 ± 0.03 ms (n = 27) in MiV2, and 0.75 ± 0.02 ms (n = 20) in MiV3.
