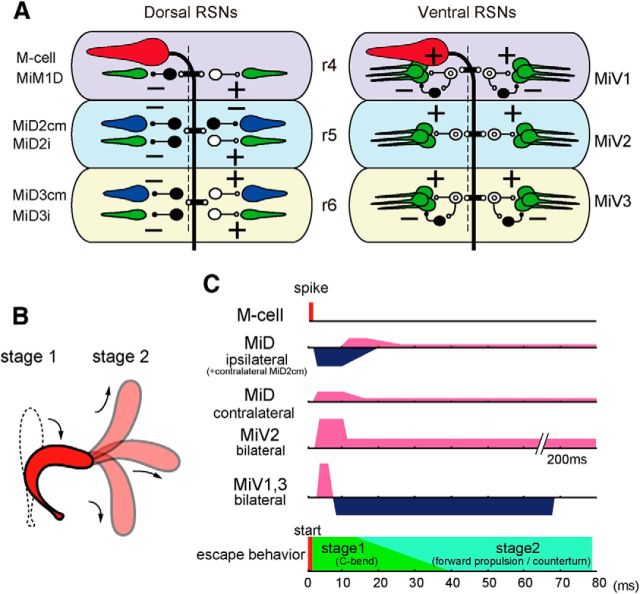
Figure 11.
Escape circuitry from the Mauthner cell to reticulospinal neurons constructed in r4–r6. A, Schematic representation of the circuits from the left M-cell to dorsally (left) and ventrally located (right) RSNs. The output of the M-cell was excitatory (possibly cholinergic, red), presumably, MiD2cm and MiD3cm cells were glycinergic (blue), and MiM1D, MiDi, and MiV cells were glutamatergic (green). Presumable interneurons between the M-cell and RSNs are represented as open (excitatory) and filled (inhibitory) symbols. + and −: excitatory and inhibitory synapse, respectively. B, Goldfish escape behavior. Silhouettes of C-bend at Stage 1 and subsequent propelling to various directions at Stage 2. C, Time course of effects of an M-cell firing on the RSNs represented on phases of C-start. The C-bend initiates ∼8 ms after the M-cell activation but here, the timing of both M-cell spike and the C-bend initiation are set at 0 ms. Excitations are denoted in pink and inhibitions in blue. The duration of asymmetrical outputs from MiD cells corresponded to the Stage 1 of escape, whereas that of symmetrical outputs from MiV cells lasted until Stage 2.

