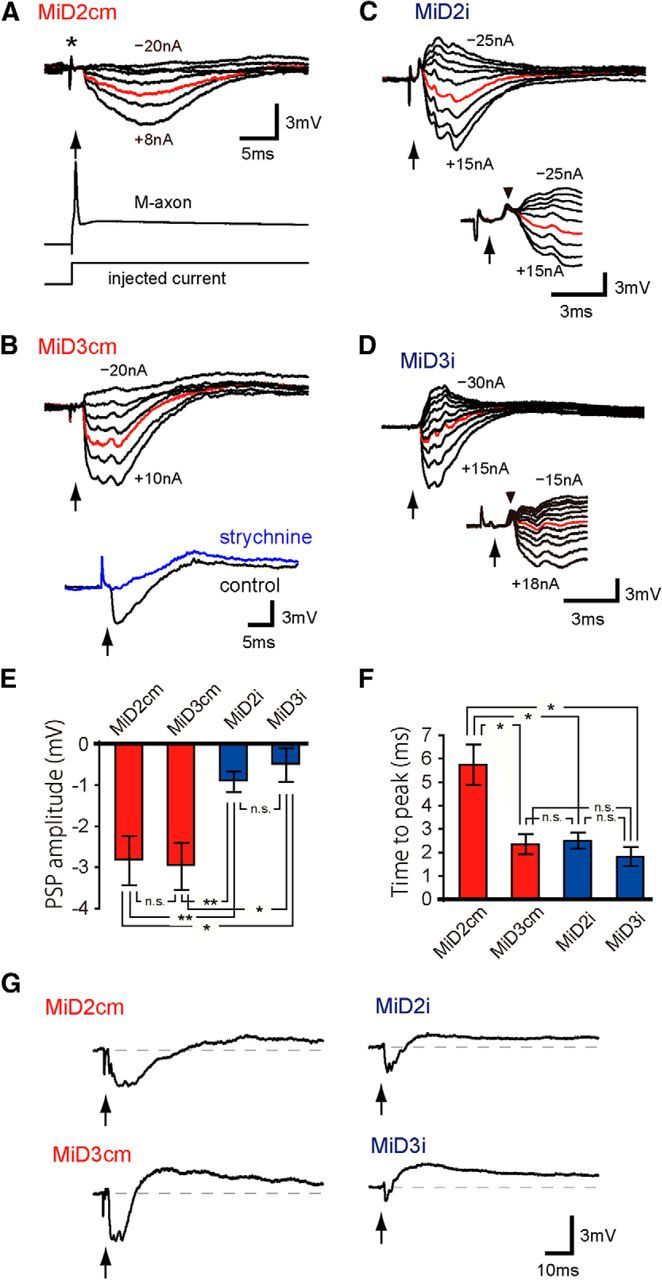
Figure 5.

Ipsilateral connections from the Mauthner cell to MiD cells in r5 and r6. Synaptic responses evoked in MiD cells by the ipsilateral M-cell firing. A–D, Intra-axonal activation of AP in the ipsilateral M-cell axon, as exemplified in the lower trace of A, and the timing of AP peak, represented by arrows (same in the following Figs. 5–8), produced a small hyperpolarization (red) in MiD2cm with Erest of −81 mV (A), in MiD3cm at −87 mV (B), in MiD2i at −77 mV (C), and in MiD3i at −74 mV (D). The intensities of the injected currents were increased by 5 nA, except for A wherein the currents were +8, +5, 0, −5, −10, −15, and −20 nA, and the range was denoted in nanoamperes for each cell. Note that artifact potentials caused by injecting currents into the M-axon for activation, appeared in the response traces (e.g., asterisk in A) before the spike of the M-axon (arrow) in most of the traces in Figures 5–8. IPSPs were blocked by applying strychnine on the remaining slow depolarizations in the MiD3cm cell (B, bottom trace). In some MiD2i and MiD3i cells, sharp depolarizations were observed before IPSPs, as exemplified in the lower traces of C and D at Erest of −77 mV and −91 mV, respectively (upper and bottom traces were obtained in different cells in D). Amplitudes of these potentials were insensitive to the polarization of the recorded cells. E, F, Bar graphs quantifying PSP amplitudes and peak times from the onset at Erest; **p < 0.01, *p < 0.05; n.s., Not significant. G, All MiD cells showed a small long-lasting depolarization (>200 ms) after initial hyperpolarization. The calibration in A is also applicable to top traces in B–D.
