
Figure 2.
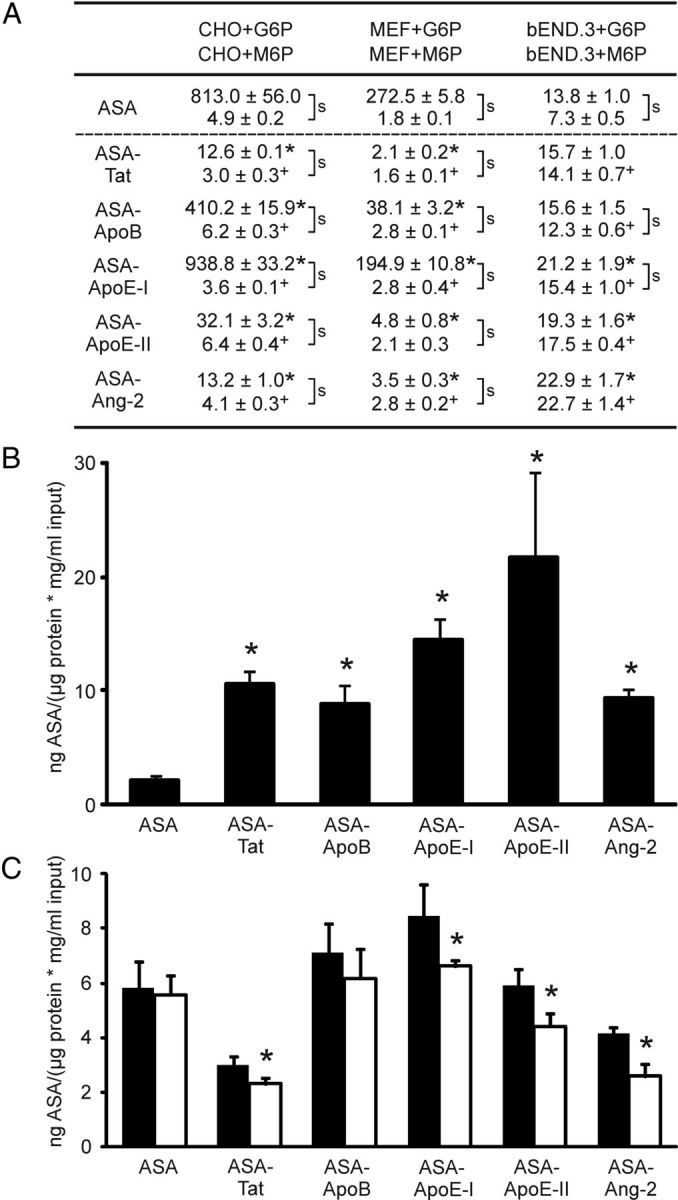
Cellular uptake of ASA fusion proteins. A, Uptake by CHO-K1, MEF, and bEND.3 cells as indicated. Cells were either coincubated with 7.5 mm M6P to block MPR300-mediated endocytosis (lower values) or, as a control, with 7.5 mm G6P (upper values). Uptake is expressed as nanograms of intracellular ASA per microgram of input ASA and micrograms of extractable protein. Numbers represent mean ± SD of n = 3 wells per condition. S-signs denote statistically significant differences between M6P and G6P feedings (Student's t test, p < 0.05). Asterisks and plus signs indicate statistical differences between an ASA fusion protein and the ASA control in the presence of G6P and M6P, respectively. B, Uptake by MEF-mpr−/− cells (deficient for MPR300). Bars represent mean ± SD of n = 4–6 wells per condition. Asterisks indicate statistically significant differences from wild-type ASA (Student's t test, p < 0.05). C, LRP1-dependent endocytosis. CHO-K1 wild-type cells (closed bars) and CHO-lrp−/− cells (deficient for LRP1; open bars) were incubated with 7.5 mm M6P to block M6P-dependent endocytosis. Bars represent mean ± SD of n = 3 wells per condition. Asterisks indicate a statistically significant difference between LRP1-deficient and wild-type CHO-K1 cells (Student's t test, p < 0.05).