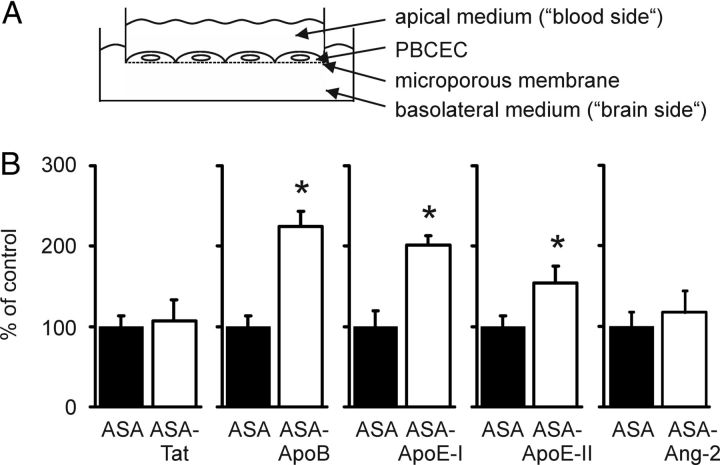
Figure 4.
Basolateral transfer of ASA fusion proteins in an in vitro BBB model. A, Scheme of the experimental setup. B, Basolateral concentrations of ASA (closed bars) and ASA fusion proteins (open bars) were measured 24 h after the addition of 0.1 mg/ml purified protein to the apical medium. Bars represent mean ± SD of n = 3–5 wells per condition. Asterisks indicate statistically significant differences between ASA and ASA fusion proteins (Student's t test, p < 0.05).

