
Figure 1.
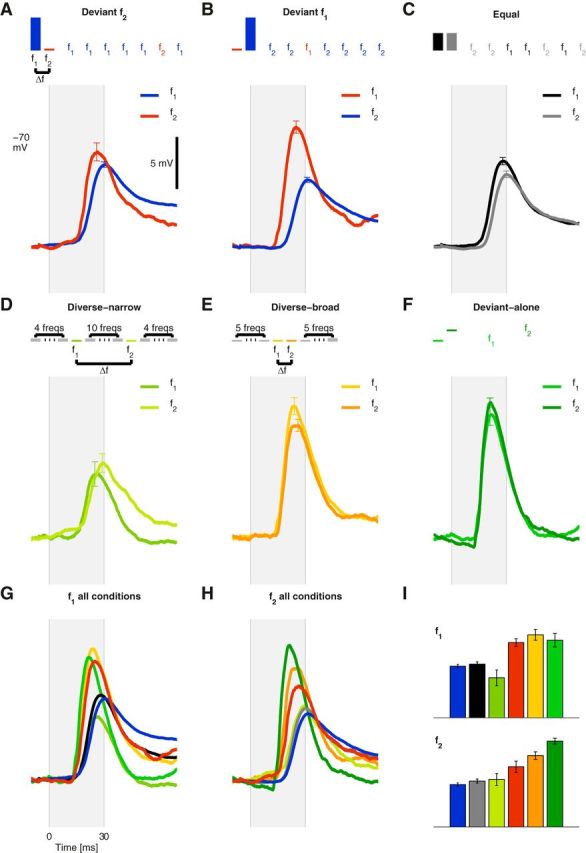
Effects of temporal context on the average membrane potential of a neuron in auditory cortex. This neuron did not have spiking responses. A, Top, A schematic representation of the Deviant f2 Oddball sequence in which two tones were presented randomly. In 95% of the trials, the low tone (f1 = 11.8 kHz) was presented and in the other 5% of the trials the high tone (f2 = 17.1 kHz) was presented (Δf = 44%). Bottom, The average membrane potential in response to f1 (blue) and f2 (red). Gray background represents stimulus presentation time (30 ms). B, Top, A schematic representation of the Deviant f1 Oddball sequence. The low tone (f1) was presented in 5% of the trials, and the high tone (f2) was presented in 95% of the trials. Bottom, Average membrane potential in response to f1 (red) and f2 (blue). C, Top, A schematic representation of the Equal control condition in which both f1 and f2 were presented in 50% of the trials. Bottom, Average membrane potential for both tones. D, Top, A schematic representation of the Diverse-narrow sequence in which the main two tones, f1 and f2, were presented among 18 other tones randomly. The ratio between adjacent tones was 3.37%. Bottom, Average response to f1 and f2 in this sequence. E, Top, A schematic representation of the Diverse-broad sequence in which the main two tones, f1 and f2, were presented among 10 other tones randomly. The spectral separation between each adjacent tone was Δf, the interval between f1 and f2 (44% here). Bottom, Average membrane potential in response to f1 and f2. F, Top, A schematic representation of the Deviant-alone sequence. Each tone was presented rarely as Deviant, while all other trials were silent. Bottom, Average responses to f1 and f2. G, Responses to f1 tone in all conditions. H, Responses to f2 tone in all conditions. I, Peak responses to f1 and f2 in all conditions. freqs, Frequencies.