
Figure 3.
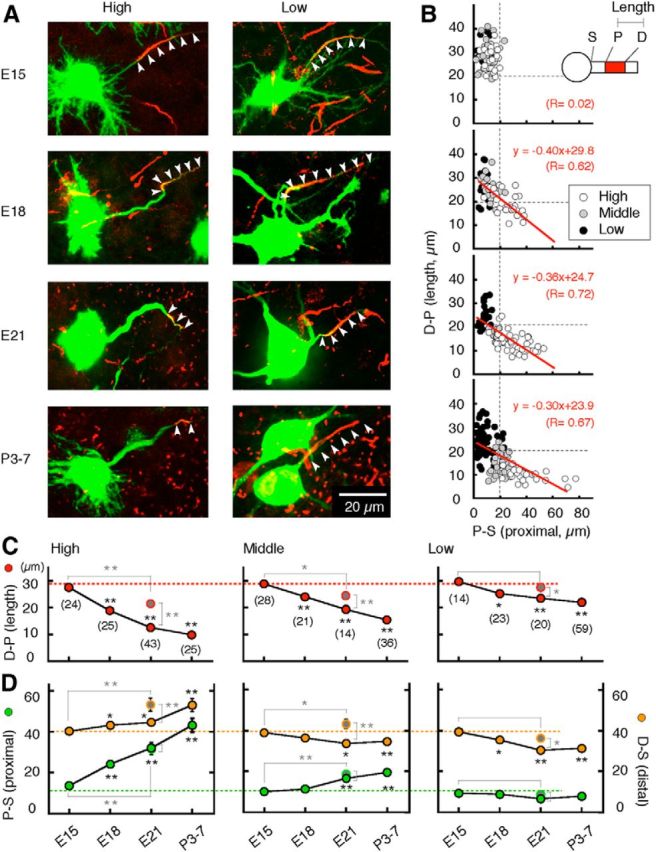
Developmental refinement of spatial distribution of the AIS. A, Immunostainings of Nav channels (red, arrowheads) after labeling of NL neurons (green). B, Correlation between length (D-P) and proximal position (P-S) of the AIS. S, P, and D denote soma, proximal, and distal ends of AIS, respectively. Each plot represents individual cells. C, Length of AIS (D-P, red). D, Proximal (P-S, green) and distal (D-S, orange) positions of the AIS relative to the soma. Gray symbols encircled by red (C) or green or orange (D) are values in animals deprived of bilateral otocysts from Figure 6. After E15, the AIS decreased in length and increased in distance of proximal position to a greater extent in the higher-CF regions. Accordingly, a negative correlation became apparent at E18, and pronounced until P3–P7. The refinement would be saturated by P3–P7, as the AIS parameters in P3–P7 were not different from those in older animals (P10, 3 animals) at each CF region (p > 0.1). In this and subsequent figures, numbers in parenthesis are the number of cells. *p < 0.05; **p < 0.01. Statistical significance was tested against E15 (black asterisks) and against otocyst-deprived animals at E21 (gray asterisks; Figs. 6, 7).