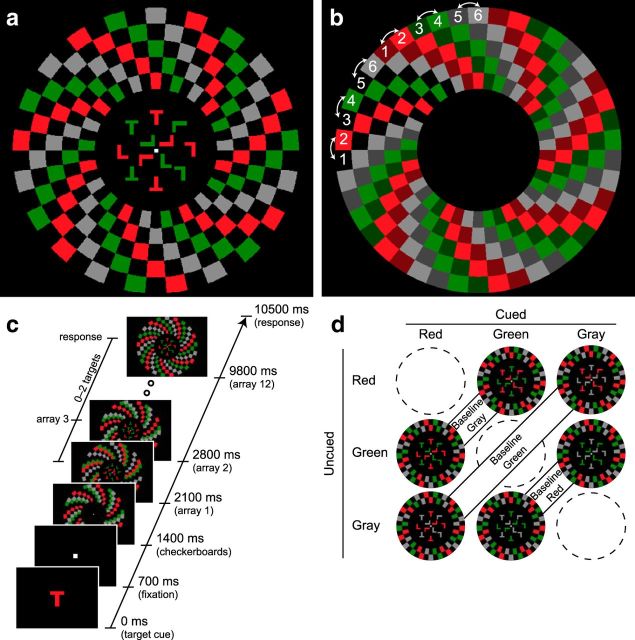
Figure 2.
Task diagram for Experiment 2. a, Stimulus displays. Participants performed conjunction searches for red, green, and gray targets. The cued and uncued colors appeared both in the central search arrays and in the peripheral checkerboards. The baseline color appeared only in the periphery. In this example, red is the cued color, green is the uncued color, and gray is the baseline color. Cued, uncued, and baseline checkerboards flickered at unique frequencies (7.6, 13.3, and 17.8 Hz). b, Description of checkerboard displays. During the trial, each checkerboard color could occupy one of two adjacent positions. In this example, red could occupy positions 1 and 2, green positions 3 and 4, and gray positions 5 and 6. These positions were counterbalanced across trials with checkerboard frequency and color. At any given moment, one of the positions for each color was unoccupied, indicated here by blank (background) space and also by a second color of the same hue (dark red, dark green, and dark gray). When one color flickered, all checks of that color shifted to the previously unoccupied location. In this manner, differently colored checks occupied adjacent but nonoverlapping locations. c, Trial sequence. The trial sequence was identical to that used in Experiment 1. d, Color combinations. In separate blocks of trials, red, green, and gray colors acted as cued, uncued, and baseline colors. Stimulus color (red, green, and gray) was therefore completely counterbalanced with color category (cued, uncued, baseline).

