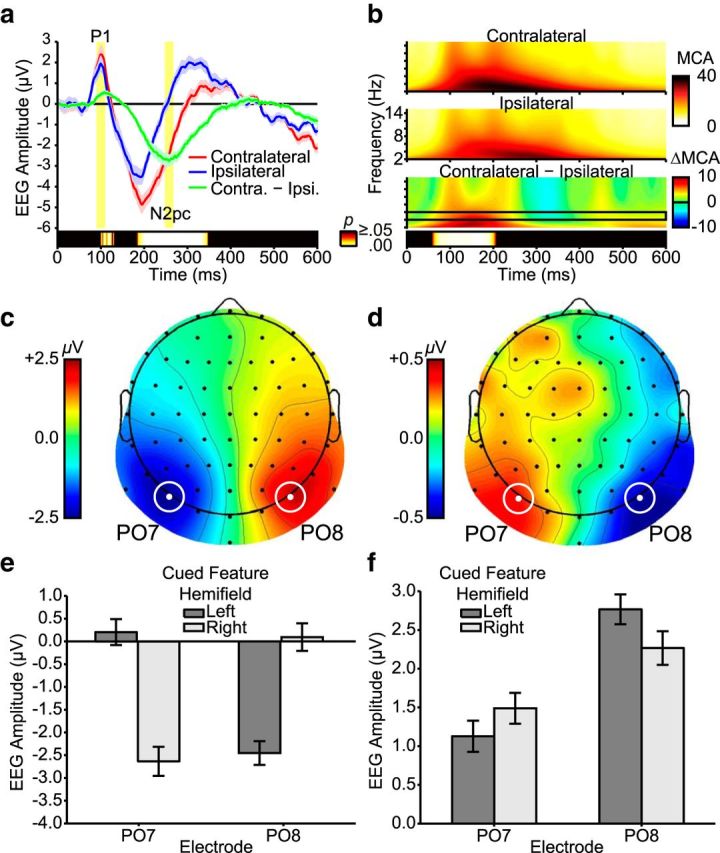
Figure 6.

Attentional selection within the central array during unique-feature search in Experiment 1. a, ERP traces averaged over PO7 and PO8 electrodes. N2pc and P1 analysis epochs are highlighted in yellow. Permutation test results for the contralateral minus ipsilateral contrast are presented at the bottom. Only significant differences corrected for family-wise error rate are presented (p < 0.05). b, Wavelet heat maps as a function electrode site (contralateral, ipsilateral), averaged over PO7 and PO8 electrodes. On the contralateral minus ipsilateral contrast map, the black frame indicates the θ range for statistical analysis (4–6 Hz). Permutation test results for this contrast are presented at the bottom. c, Scalp topography during the N2pc epoch created by subtracting ERPs for left hemifield cued features from ERPs for right hemifield cued features. This plotting convention allows topographies to deviate from symmetry on the sagittal plane and consequently reveals hemispheric asymmetries if they are present (Dowdall et al., 2012; Sawaki et al., 2012). d, Scalp topography during the P1 epoch created by subtracting ERPs for left hemifield cued features from ERPs for right hemifield cued features. e, N2pc amplitudes as a function of electrode and cued feature hemifield. f, P1 amplitudes as a function of electrode and cued feature hemifield. Error shading (a) and error bars (e, f) indicate within-subjects SE.
