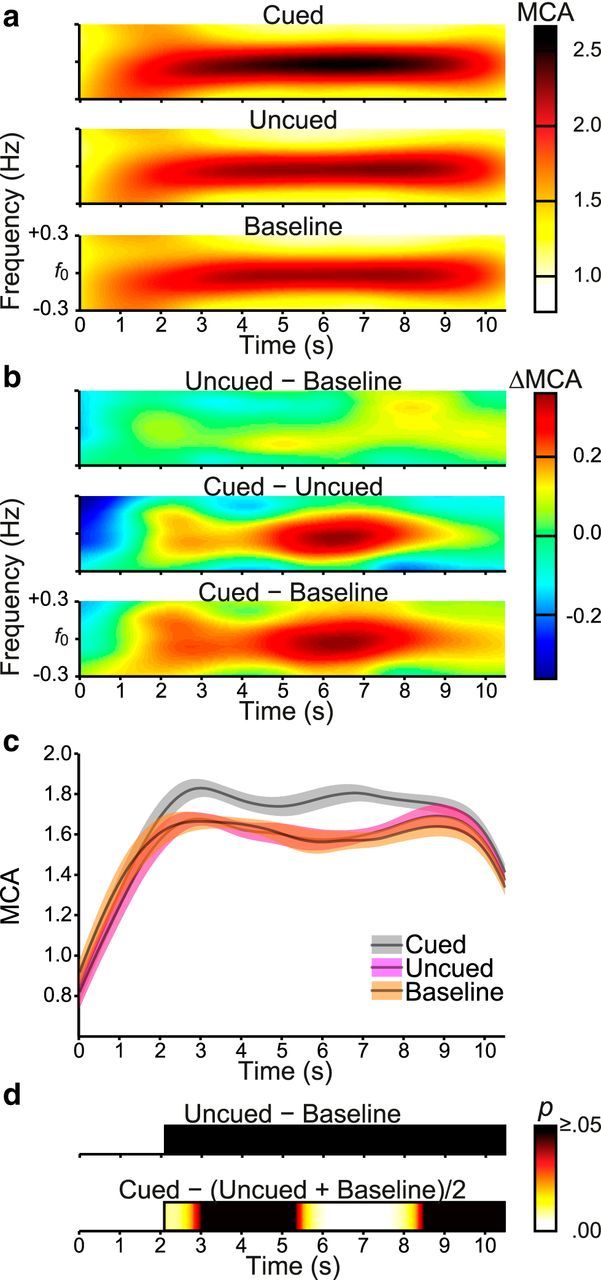
Figure 9.

Morlet wavelet time-frequency analyses of attentional modulation in Experiment 2. Results reflect the average of 7.6 Hz and 13.3 Hz checkerboard frequencies and are plotted from cue onset to the final search array offset. a, Wavelet heat maps. b, Wavelet contrast heat maps. c, Wavelet amplitudes averaged over the range f0 ± 0.24 Hz (f0 = fundamental checkerboard frequency). Error shading represents within-subjects SE. d, Permutation t tests conducted at each time point from flicker onset (2.1 s). Only significant differences corrected for family-wise error rate are presented (p < 0.05).
