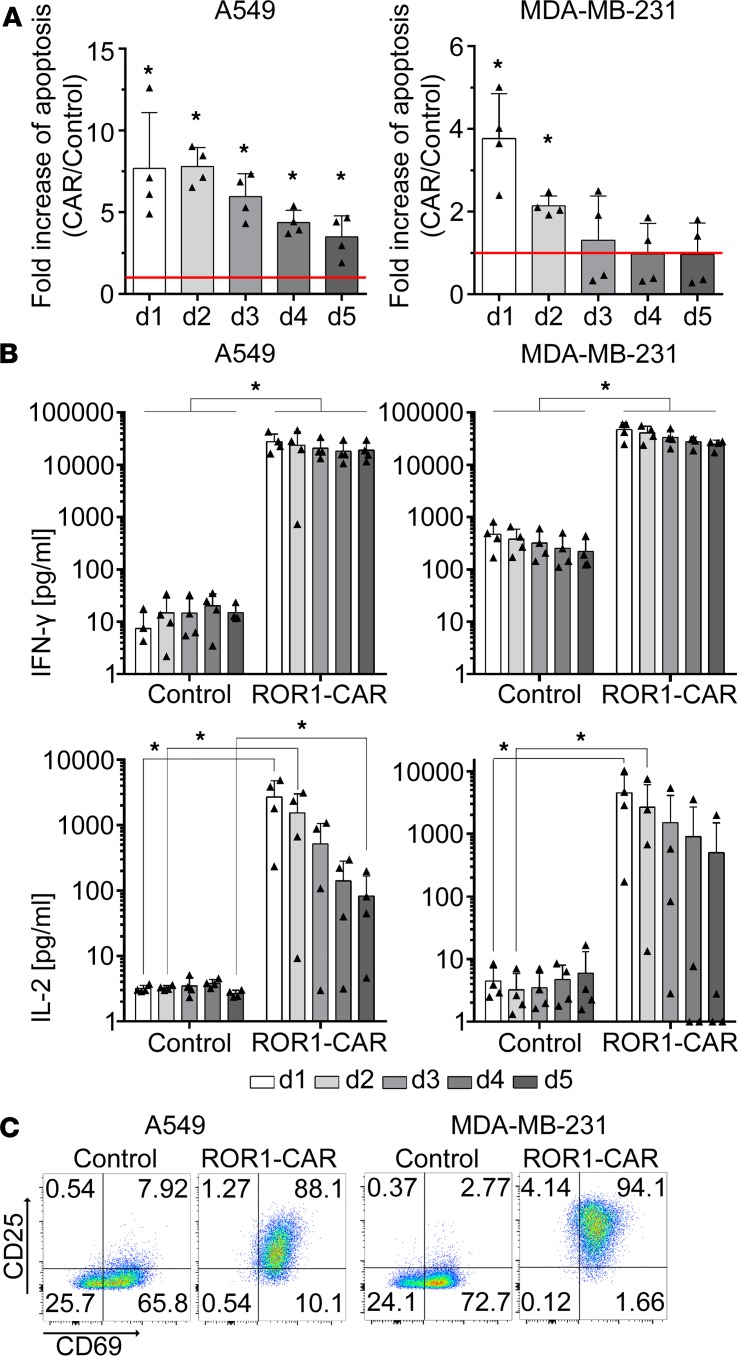
Figure 5. ROR1-CAR T cells induce tumor cell apoptosis of 3D lung and breast cancer in dynamic culture.
(A) Quantification of apoptosis induced by ROR1-CAR T cells during 5 days of treatment. Apoptosis was measured with M30 ELISA from supernatants collected at the indicated time points and is presented as fold change compared with the respective control T cell treatment (red line). n = 4. Data are presented as arithmetic mean ± SD, Wilcoxon’s rank-sum test: *P < 0.05. (B) ELISA-based quantification of IFN-γ and IL-2 from supernatants collected over time from dynamic tumor models treated with T cells for 5 days. n = 4. Data are presented as arithmetic mean ± SD, Wilcoxon’s rank-sum test: *P < 0.05. (C) After 5 days of treatment, CD8+ T cells were analyzed for expression of CD25 and CD69 by flow cytometry. One representative plot of n = 4 experiments is shown.

