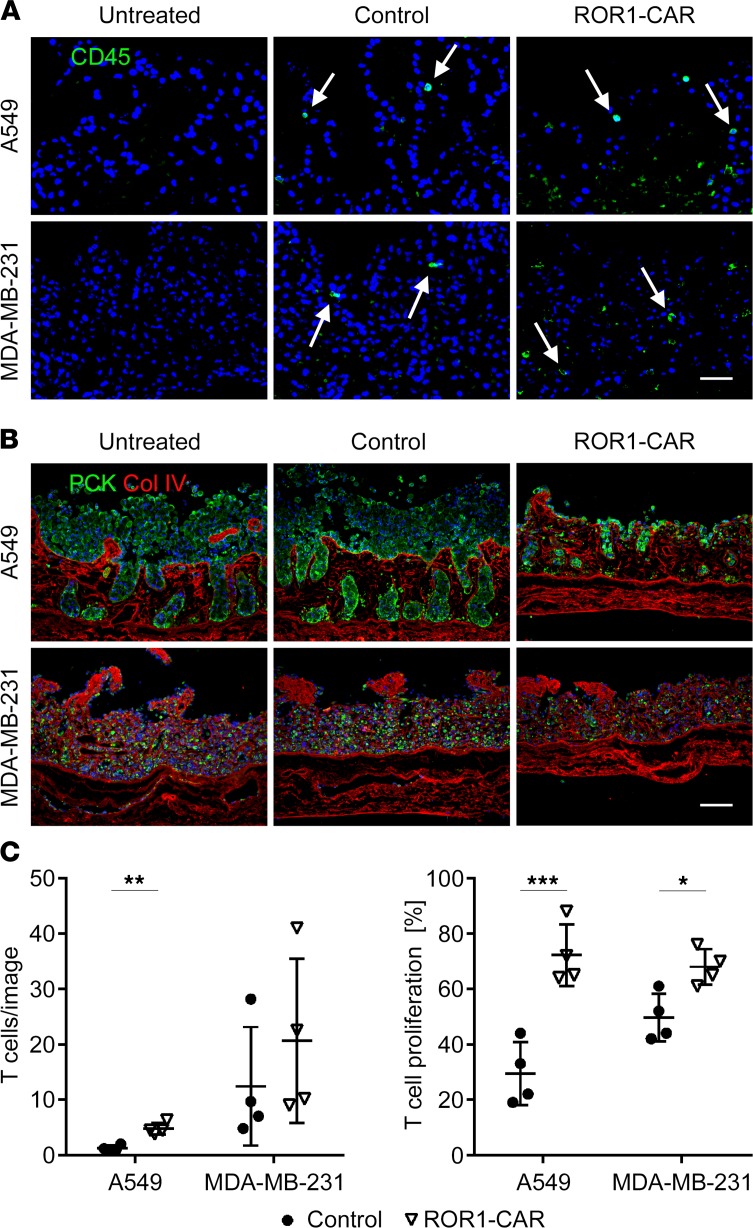
Figure 6. ROR1-CAR T cells migrate into tumor tissue and induce tumor cell lysis in a dynamic 3D culture.
(A) Immunofluorescence staining of CD45 (green) on paraffin sections of dynamic tumor models treated with control or ROR1-CAR T cells. White arrows mark T cells that had migrated into the tissue matrix. Nuclei are counterstained with DAPI (blue). Scale bar: 100 μm. (B) Immunofluorescence double staining of PCK (green) and Col IV (red) on paraffin sections of untreated dynamic tumor models as well as tumor models treated with CD4+ and CD8+ untransduced control T cells or CD4+ and CD8+ ROR1-CAR T cells with a total T cell number of 1 × 10⁷ per condition. Scale bar: 100 μm. (C) Mean number of T cells per image and T cell proliferation assessed by quantification of Ki67/CD45 immunofluorescence double staining. CD45+ and Ki67+CD45+ cells were counted in 10 images per condition. n = 4. Data are presented as arithmetic mean ± SD, 2-tailed Student’s t test: *P < 0.05; **P < 0.01; ***P < 0.001.

