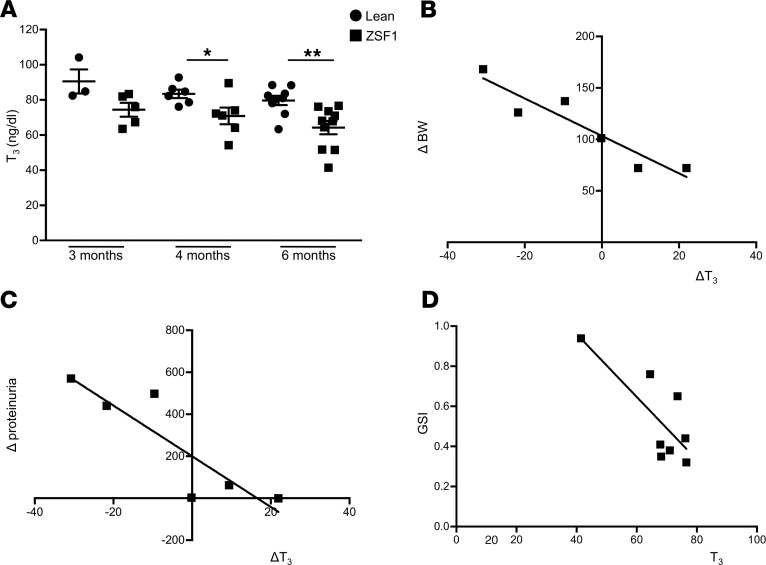
Figure 1. Changes in T3 levels and correlation of T3 with obesity and renal function parameters in diabetic rats.
(A) Serum T3 levels (ng/dl) declined progressively in ZSF1 rats at 3, 4, and 6 months of age compared with control rats. Data are expressed as mean ± SEM. *P < 0.05, **P < 0.01, unpaired Student’s t test. n = 3–10 rats per group. (B–D) Relationship between T3 levels and parameters of obesity or renal disease in ZFS1 rats at 6 months of age. ΔT3 levels (ng/dl) between 6 and 4 months of age inversely correlated with (B) ΔBW (g) (R2 = 0.8754, P = 0.0061, n = 6 rats) and (C) with Δproteinuria levels (mg/day) (R2 = 0.7822, P = 0.0193, n = 6 rats). (D) T3 levels negatively correlated with GSI in ZSF1 rats (R2 = 0.6154, P = 0.0212, n = 8 rats). R2 values are determined by linear regression. GSI, glomerulosclerosis index.

