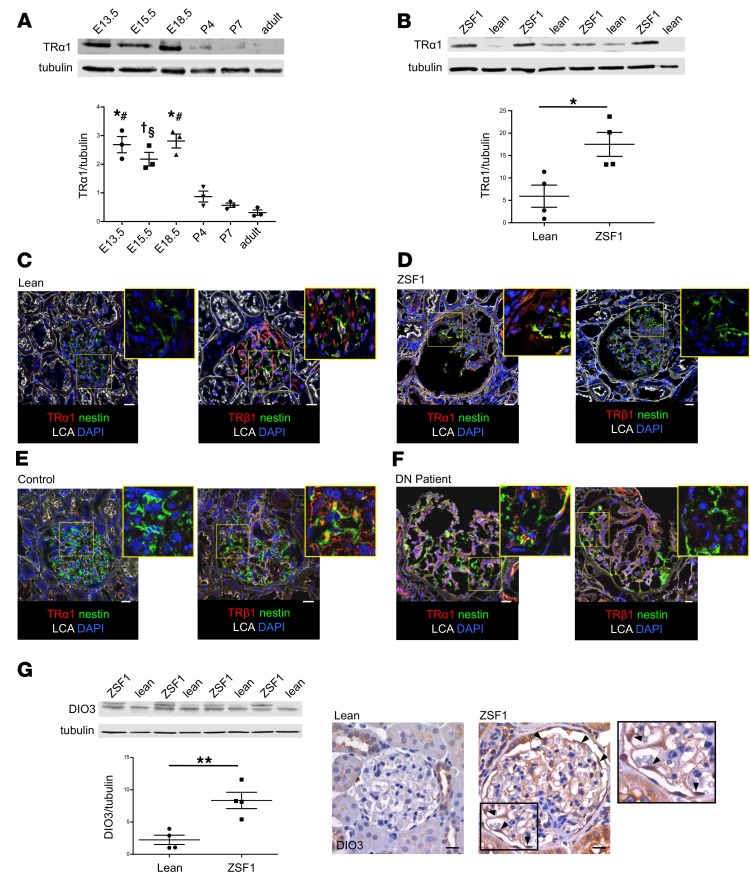
Figure 2. Adoption of fetal expression pattern of TRs and DIO3 during DN.
(A) Western blot and densitometric analysis of TRα1 protein levels. TRα1 was highly expressed in rat embryonic kidneys (E13.5–E18.5) and significantly reduced after birth. Data are expressed as mean ± SEM. *P < 0.0001 vs. P7 and adult, †P < 0.0005 vs. adult, #P < 0.0005 vs. P4, §P < 0.01 vs. P4 and P7, 1-way ANOVA corrected with Tukey’s post hoc test. n = 20 E13.5, n = 16 E15.5, n = 12 E18.5, n = 3 postnatal and adult kidneys. (B) TRα1 levels increased in kidneys of ZSF1 rats compared with lean rats at 6 months of age. *P < 0.05, unpaired Student’s t test. n = 4 rats per group. (C–F) Representative images of TRα1 and TRβ1 protein stainings in kidney sections from (C) lean and (D) ZSF1 rats and in (E) portions of control human kidney tissue and (F) from renal biopsies of DN patient. TRα1 (red) was expressed in nestin-positive (green) podocytes and parietal cells of ZSF1 rats and DN patients, while it was almost absent in lean rats and control human tissue (C–F, left). Conversely, TRβ1 (red) was highly expressed in glomerular tuft and podocytes of lean rats and human controls, while it was lower in ZSF1 rats and DN patients (C–F, right). n = 3 rats and n = 3 human subjects per group. (G) Western blot and densitometric analysis of DIO3 protein levels (left). DIO3 levels increased in kidneys of ZSF1 rats compared with lean rats. Representative images of DIO3 staining in lean and ZSF1 rat kidneys (right). DIO3 was highly expressed in glomerular tuft, parietal cells, and podocytes of ZSF1 rats (right, arrows). Data are expressed as mean ± SEM. **P < 0.01, unpaired Student’s t test. n = 4 rats per groups. Tubulin protein expression was used as sample loading control. Scale bars: 20 μm. LCA, Lens culinaris agglutinin.

