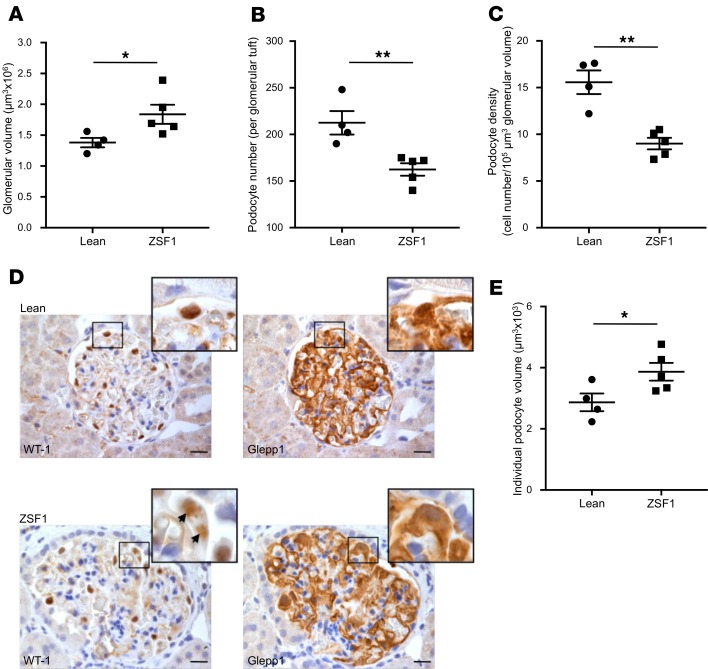
Figure 4. Glomerular volume and podocyte depletion and hypertrophy in ZSF1 rats.
(A and B) Quantification of glomerular volume and WT-1–positive podocytes in lean and ZSF1 rats at 6 months of age. Diabetic rats exhibited (A) increased glomerular volume, (B) decreased number of podocytes per glomerulus, and (C) lower podocyte density compared with lean controls. (D) Representative images of WT-1 and Glepp1 staining on serial sections in lean and ZSF1 rats. Insets show enlarged images of podocytes and highlight a polynucleated podocyte. (E) Quantification of individual podocyte volume in lean and ZSF1 rats. Diabetic rats had significantly greater podocyte volume compared with lean controls. Data are expressed as mean ± SEM. *P < 0.05; **P < 0.01, unpaired Student’s t test. n = 4–5 rats per group. Scale bars: 20 μm.

