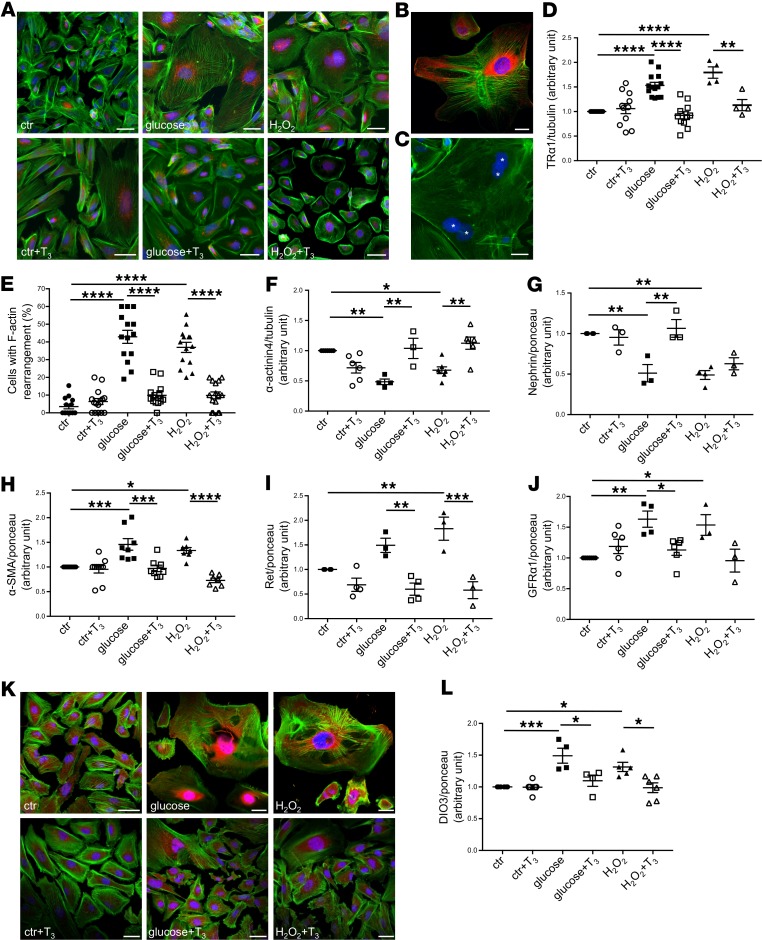
Figure 5. High glucose and oxidative stress induce TRα1 reexpression and podocyte dedifferentiation in vitro that are reversed by T3.
(A) Representative images of TRα1 (red) and F-actin (green) staining in human podocytes. Both high levels of glucose and H2O2 induced TRα1 overexpression and partial translocation from the nucleus to cytoplasm and increased cell size (top). T3 treatment of stimulated podocytes decreased TRα1 expression and restored its nuclear and perinuclear localization, and reduced cell size, but had no effect on control cells (bottom). (B) A representative image of TRα1 (red) and F-actin (green) staining of injured podocytes. (C) Multinucleated podocytes were visible after glucose treatment (asterisks). (D) Densitometric analysis of TRα1 protein levels in podocytes by Western blot. Both glucose and H2O2 increased TRα1 expression significantly, and T3 treatment markedly reversed this effect. (E) Quantification of podocytes with peripheral F-actin distribution. Diabetic stimuli caused F-actin rearrangements that were reversed by T3. (F–J) Densitometric analysis of (F) α-actinin4, (G) nephrin, (H) α-SMA, (I) Ret, and (J) GFRα1 proteins by Western blot. Diabetic stimuli decrease the expression of adult podocyte markers (F and G), cause the reexpression of the mesenchymal marker α-SMA (H), and increase Ret (I), and GFRα1 (J) protein levels. T3 treatment markedly reversed all these changes. (K) Representative images of DIO3 (red) and F-actin (green) staining in human podocytes. Both high glucose and H2O2 stimulation induced DIO3 upregulation mostly in the nuclear and perinuclear regions (top). T3 treatment of injured podocytes decreased DIO3 expression while having no effect on control cells (bottom). (L) Densitometric analysis of DIO3 protein levels in podocytes by Western blot. Both glucose and H2O2 markedly increased DIO3 expression compared with control. T3 treatment reversed this effect. Data from 3 independent experiments are expressed as mean ± SEM. *P < 0.05; **P < 0.01; ***P < 0.001; ****P < 0.0001, 1-way ANOVA corrected with Tukey’s post hoc test. n = 3–15 samples per each condition. Tubulin protein expression (D and F) or ponceau red staining (G–J and L) was used as loading control. Scale bars: 50 μm.

