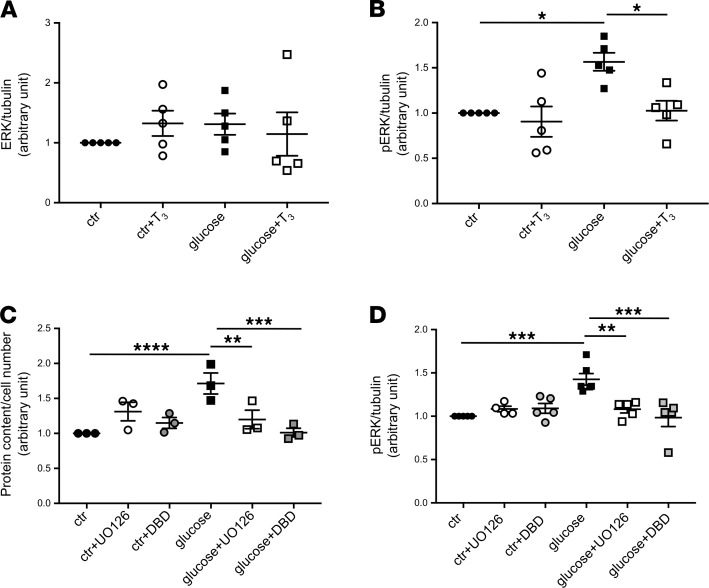
Figure 7. TRα1 regulates glucose-induced hypertrophy through downstream activation of ERK1/2.
(A and B) Densitometric analysis of (A) ERK1/2 and (B) pERK1/2 protein in podocytes by Western blot. (A) Podocyte total ERK1/2 protein expression was not changed either by glucose or T3 treatment. (B) Glucose induced an increase in pERK1/2 protein levels, which were significantly reduced by T3 treatment. (C) Quantification of hypertrophy expressed as protein content per cell number. Glucose induced podocyte hypertrophy, which was prevented by UO126 and DBD. Neither UO126 nor DBD had any effect on untreated cells. (D) Densitometric analysis of pERK1/2 protein in podocytes by Western blot. The increase in pERK1/2 protein levels in glucose-stimulated podocytes was prevented by administering UO126 or DBD. Tubulin protein expression was used as sample loading control (A, B, and D). Data from 3 independent experiments are expressed as mean ± SEM. *P < 0.05; **P < 0.01; ***P < 0.001; ****P < 0.0001, 1-way ANOVA with Tukey’s post hoc test. n = 3–6. pERK1/2, phospho-ERK1/2.

