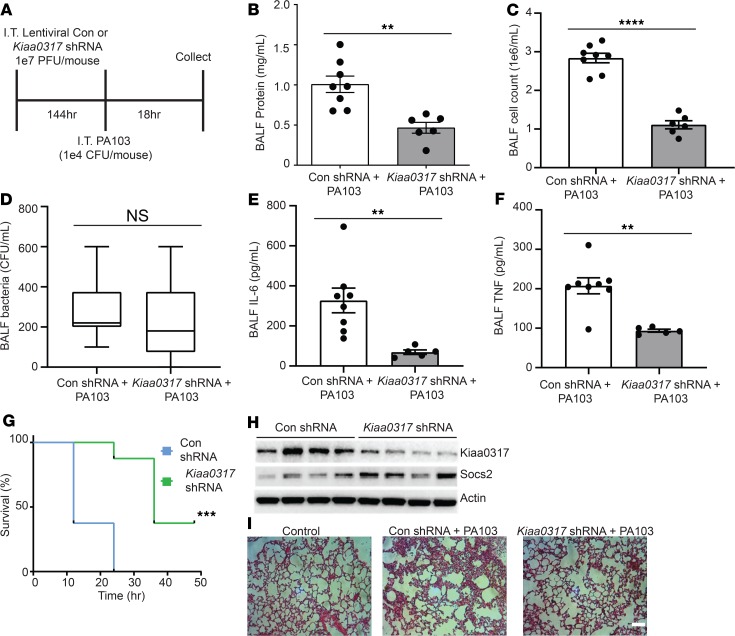
Figure 4. Kiaa0317 knockdown ameliorates Pseudomonas-induced lung injury in vivo.
(A) Treatment strategy for lentiviral infection (1 × 10⁷ PFU/mouse) and PA103 exposure (1 × 10⁴ CFU/mouse). Mice were euthanized, and lungs were lavaged with saline and harvested. Con, control. (B–D) Protein concentration, cell count, and bacterial count measurements in BALF from treated mice (n = 6–8 mice per group). In D, box represents interquartile range; line, median; and whiskers, highest and lowest values. (E and F) ELISA analysis of BALF cytokines IL-6 and TNF. (G) Survival studies of mice exposed to PA103 (i.t. 1 × 10⁵ CFU/mouse, n = 8 mice per group). Mice were monitored over time; moribund, preterminal animals were immediately euthanized and recorded as deceased. Kaplan-Meier survival curves were generated and compared; data represent mean values (n = 8 mice per group). (H) Immunoblot analysis from representative murine lung homogenate; n = 4 per group. (I) Histology of murine lungs following H&E staining; scale bar: 100 μm. **P < 0.01, ***P < 0.001, ****P < 0.0001, NS: P > 0.05 compared with control shRNA, 2-tailed unpaired Student’s t test (B–F) or compared with control shRNA, log-rank (Mantel-Cox) test (G).

