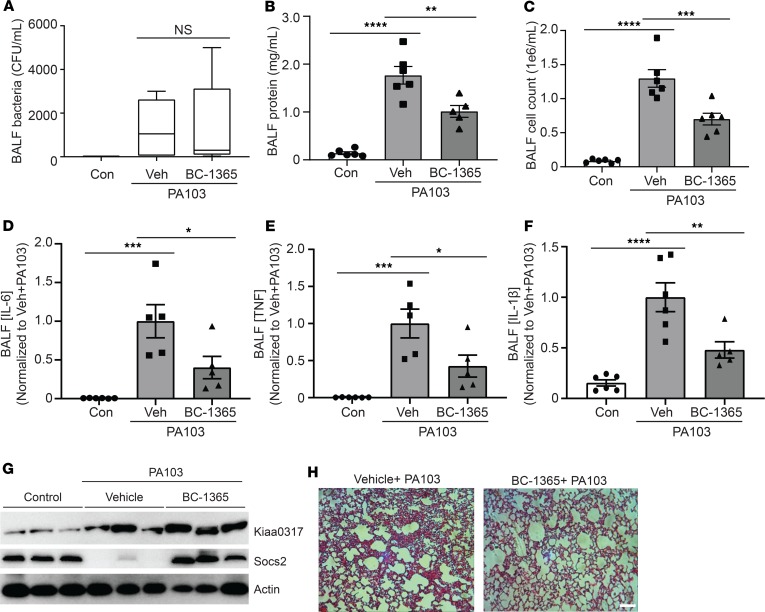
Figure 9. KIAA0317 small molecule inhibitor is antiinflammatory in vivo.
(A–E) C57BL/6J mice were exposed to PA103 and treated with BC-1365 for 18 hours. Following exposure, mice were sacrificed, and lungs were lavaged with saline and harvested. Box represents the interquartile range; line, the median; and whiskers, highest and lowest values. (A–C) Bacterial count, protein concentration, and cell count measurements from BALF. (D–F) BALF cytokine concentrations. Veh, vehicle. In A–F, data represent mean values ± SEM; n = 4–8 mice. NS: P > 0.05, *P < 0.05, **P < 0.01, ***P < 0.001, ****P < 0.0001 compared with control mice or as indicated; 1-way ANOVA with Tukey’s multiple-comparisons test. (G) Immunoblotting of mouse lung homogenate for Kiaa0317 and Socs2 protein signal; n = 3 mice per treatment. (H) Representative histology of murine lungs following H&E staining; scale bar: 100 μm.

