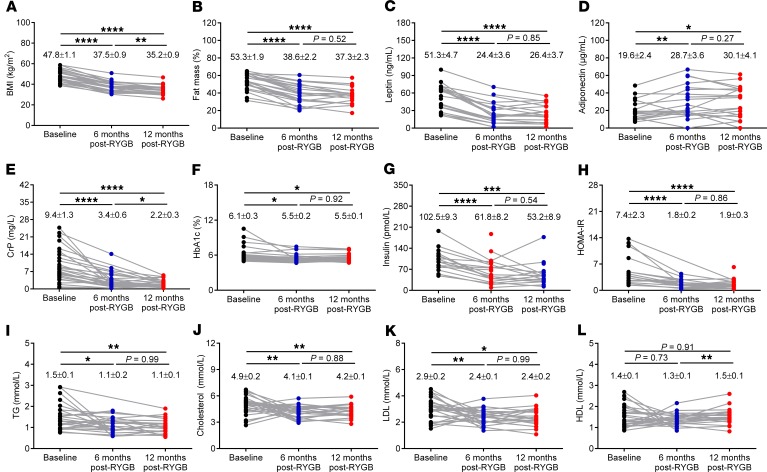
Figure 1. RYGB markedly improves BMI, body fat mass, and circulating inflammatory and metabolic markers in obese patients.
(A) BMI, (B) fat mass percentage (%), (C) plasma leptin, (D) adiponectin, (E) C-reactive peptide (CrP), (F) glycated hemoglobin (HbA1c), (G) insulin, (H) homeostatic model of insulin resistance (HOMA-IR), (I) triglycerides (TG), (J) cholesterol, (K) LDL, and (L) HDL in morbidly obese patients at baseline (n = 16–27), 6 months (n = 22–27), and 12 months (n = 17–27) after RYGB. Numbers in each graph represent mean ± SEM. Statistical significance was determined by mixed-effects model analysis with Tukey’s post hoc test. **** P < 0.0001, *** P < 0.001, ** P < 0.01, and * P < 0.05.

