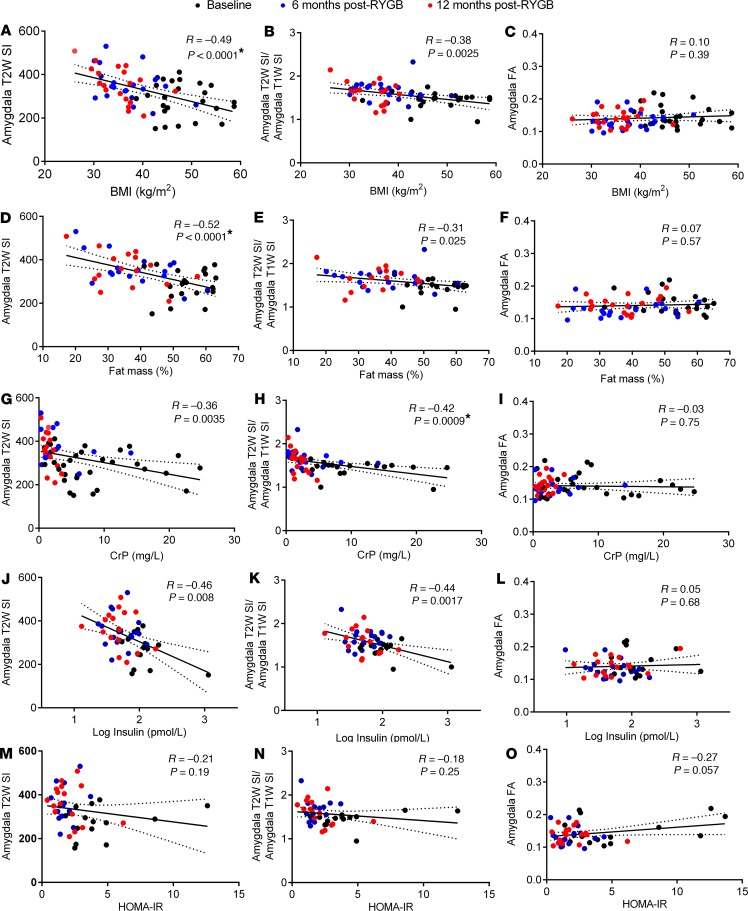
Figure 4. Relationships between BMI, body fat mass, circulating inflammatory and metabolic markers with radiologic measures of amygdala inflammation in RYGB patients.
(A–O) Univariate linear regressions and Pearson correlations between BMI (A–C), fat mass % (D–F), plasma CrP (G–I), log plasma insulin (J–L), and HOMA-IR (M–O) with mean amygdala T2W SI (A, D, G, J, and M), T2W/T1W SI ratios (B, E, H, K, and N), and FA values (C, F, I, L, and O) of RYGB patients at baseline (n = 14–24), 6 months (n = 15–23), and 12 months after surgery (n = 14–21). Solid regression lines indicate least squares fit of data, and dotted lines indicate 95% CI. P values were determined by 2-tailed Student’s t test. Asterisk signifies correlations that remained statistically significant after Bonferroni correction for multiple comparisons (P < 0.0014).

