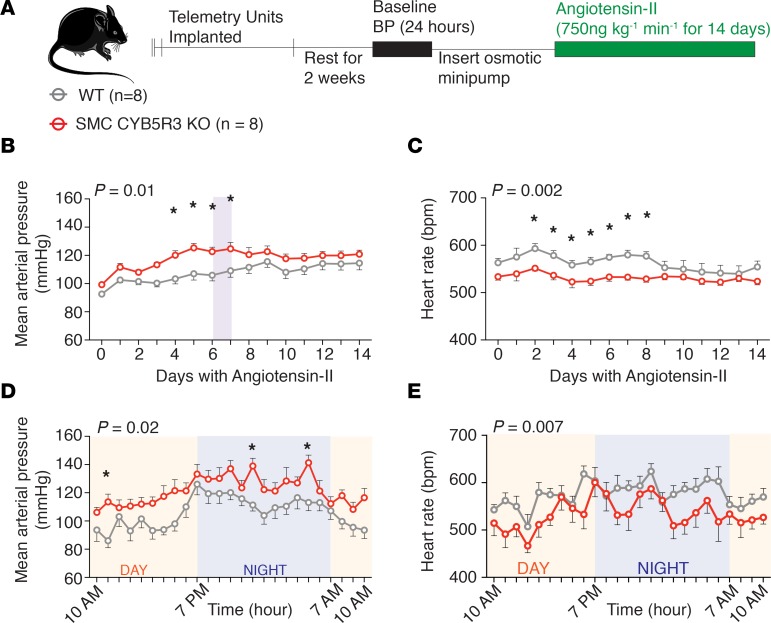
Figure 3. SMC CYB5R3–KO mice have an exacerbated hypertensive response to Ang II compared with WT mice.
(A) Experimental design showing WT (n = 8, gray) and SMC CYB5R3–KO (n = 8, red) mice were implanted with telemetry units then subsequently with osmotic pumps delivering 750 ng kg–1 min–1 Ang II. BP was measured continuously 24 hours prior to and for the duration of Ang II treatment. (B) MAP (mmHg) and (C) heart rate (bpm) averaged and plotted per day for the course of 14 days shows SMC CYB5R3–KO mice have an increased MAP and decreased heart rate as compared with WT mice particularly during the first 7 days of Ang II treatment. Shaded regions highlight days 6–7 of Ang II where peak differences were observed between WT and SMC CYB5R3–KO. (D) The hourly MAP (mmHg) recording and (E) heart rate for the shaded regions in B and C for the 24 hours between days 6–7 of Ang II treatment. (A–E) The P value represents a difference across genotype by 2-way repeated-measures ANOVA with *P values < 0.05 as determined by post hoc Sidak multiple comparison tests. (B–E) Error bars are ± SEM.

