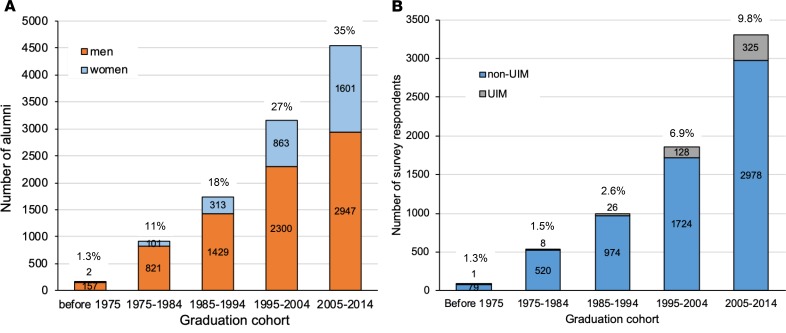
Figure 1. Distribution of MD-PhD program graduates by sex and race/ethnicity who graduated during the indicated decadal intervals.
(A) Numbers of men (orange) and women (blue) who graduated in the indicated cohorts. Percentage of women graduates is indicated above each bar. Note that the numbers represent all graduates identified by the participating programs, including survey responders and nonresponders. (B) Number of survey responders who identified as belonging to a group defined by the NIH as underrepresented in medicine (UIM) (gray) and all other survey responders (non-UIM) (blue) who graduated in the indicated cohorts. Percentage of UIM graduates is indicated above each bar.

