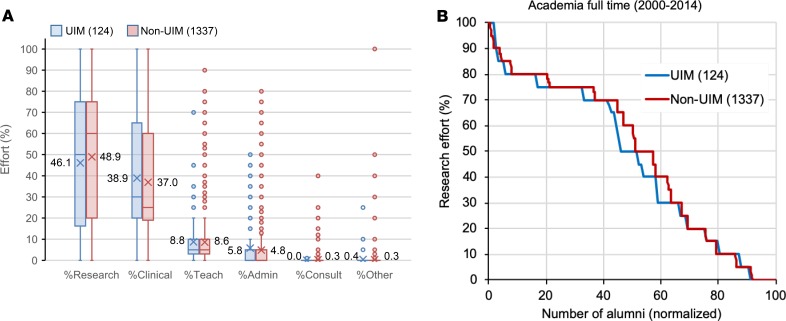
Figure 12. Research and other effort for alumni with a current position in academia full-time by UIM status.
(A) Average percent effort for alumni who graduated between 2000–2014 in academia full-time for research, clinical, teaching, administration, consulting, and other for UIM (blue bars) and non-UIM (red bars). For each individual, total effort had to sum to 100%. Boxes indicate the second and third quartiles. Whiskers are drawn using Tukey’s criterion of 1.5× the interquartile range. Outliers beyond the whiskers are shown. X indicates the average, which is indicated to the left or right of the box. Horizontal bar in the box indicates the median. In Supplemental Figure 3, the data are displayed in bar graph format showing the mean ± SEM. (B) Percent research effort for alumni by UIM status. Individuals are rank ordered by reported research effort and the percentage of individuals reporting a given research effort is plotted for UIM and non-UIM. The number of UIM and non-UIM is indicated in parentheses. UIM, blue line; non-UIM, red line.

