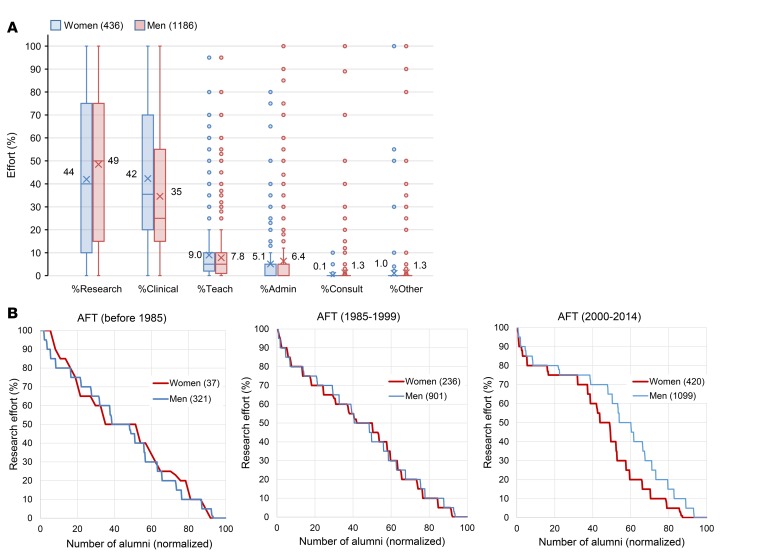
Figure 6. Research and other effort for alumni who have completed postgraduate training with a current position in academia full-time (AFT) by sex.
(A) Average percent effort for research, clinical, teaching, administration, consulting, and other for women (red bars) and men (blue bars). For each individual, total effort had to sum to 100%. (B) Percent research effort for graduates by sex and graduation cohort. Individuals are rank ordered by reported research effort, and the percentage of individuals reporting a given research effort is plotted for women (red line) and men (blue line). The number of women and men in each cohort is indicated. For AFT (2000–2014), there is a significant difference in the research effort for women and men by unpaired 2-tailed t test (P = 0.0004).

