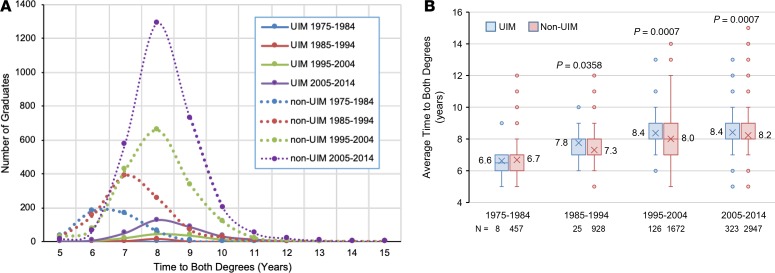
Figure 8. Time to graduation with both degrees as a function of underrepresented in medicine (UIM) status and decade of graduation.
(A) Time to degree distribution by UIM status and decade of graduation. UIM, solid lines; non-UIM, dotted lines. Colors indicate graduation decade cohort. Note that all of the UIM curves are below 200 graduates. (B) Box and whisker plots of time to both degrees for UIM (blue bars) and non-UIM (red bars) as a function of decade of graduation. Boxes indicate the second and third quartiles. Whiskers are drawn using Tukey’s criteria of 1.5× the interquartile range. Outliers beyond the whiskers are shown. Boxes indicate the second and third quartiles. Whiskers are drawn using Tukey’s criteria of 1.5× the interquartile range. Outliers beyond the whiskers are shown. X indicates the average, which is indicated to the left or right of the box. Horizontal bar in the box indicates the median. P values indicate significant difference between UIM and non-UIM by unpaired 2-tailed t test. In Supplemental Figure 2, the data are displayed in bar graph format showing the mean ± SEM.

