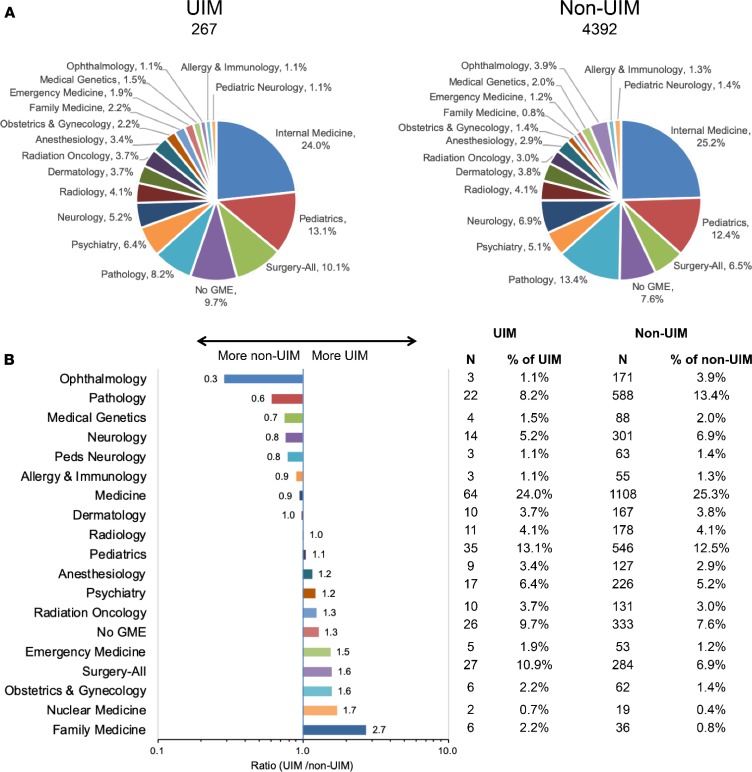
Figure 9. Choice of graduate medical education (GME) specialty by all survey respondents who have completed postgraduate training subdivided by UIM status.
(A) GME choice by UIM status. (B) Differences in GME choice for alumni who have completed training by UIM status. The x axis scale is the ratio (%UIM/%non-UIM) training in a given specialty. Numbers next to each bar gives the ratio of the percentage of UIM divided by the percentage of non-UIM training in the indicated specialty. Note that the x axis is a log scale. Table shows the numbers of UIM and non-UIM alumni and the percentage training in each specialty.

