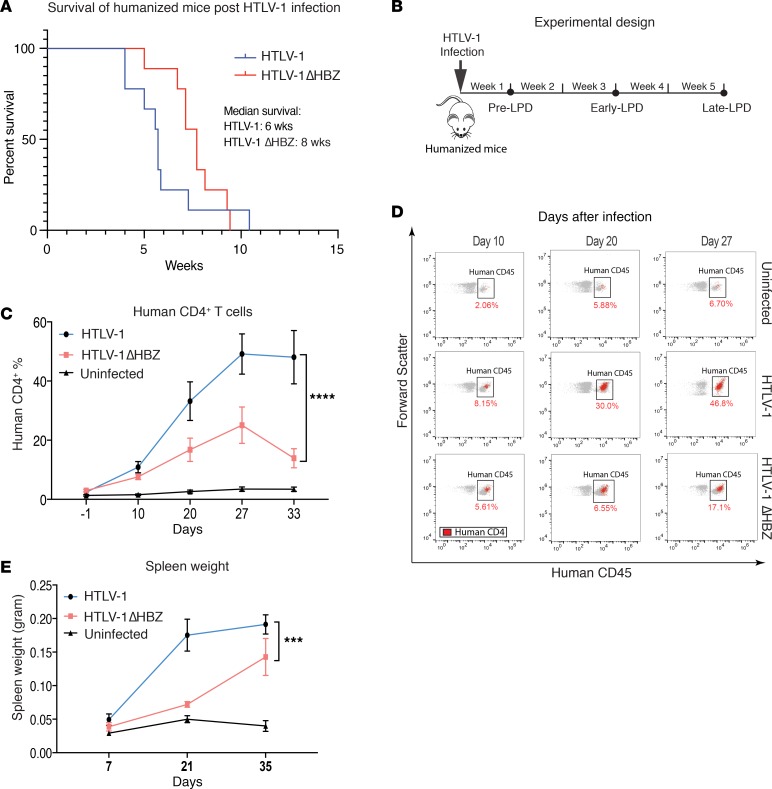
Figure 1. HTLV-1–infected humanized mice develop lymphoproliferative disease (LPD).
(A) Kaplan-Meier survival curves of humanized mice infected with HTLV-1 (n = 9) and HTLV-1 ΔHBZ (n = 9) viruses. (B) Experimental design: humanized mice were infected with HTLV-1 or HTLV-1 ΔHBZ and examined at pre-LPD (1 week after infection), early-LPD (3 weeks after infection), and late-LPD (5 weeks after infection). (C) The average percentage of human CD4+ T cells present in the peripheral blood of humanized mice infected with HTLV-1 (n = 8) and HTLV-1 ΔHBZ (n = 8) viruses obtained by flow cytometry over the course of 5 weeks. Error bars represent ± SEM and ****P < 0.0001 (2-way ANOVA). (D) Representative scatter plots of flow data obtained on days 10, 20, and 27 depicting the expansion of human CD45+ (box) CD4+ (red dots) T cells in peripheral blood of infected humanized mice over the course of disease progression. (E) The average spleen weight as an additional measure of LPD in infected humanized mice, obtained on days 7, 21, and 35. Error bars represent ± SEM. ***P < 0.001 (2-way ANOVA).

