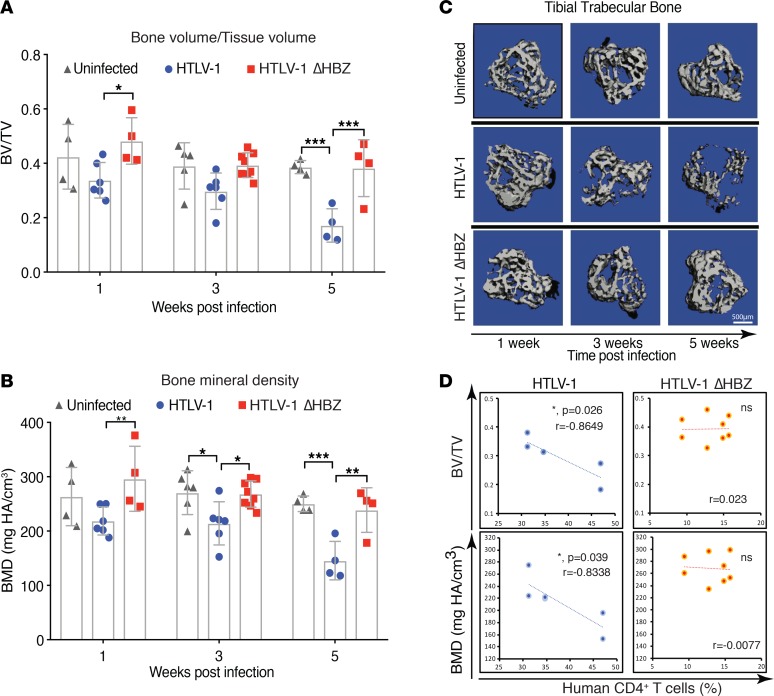
Figure 2. Deletion of HBZ partially rescues tumor-associated bone loss in HTLV-1–infected humanized mice.
(A and B) μCT analysis for calculation of trabecular bone to tissue volume ratio (BV/TV) and bone mineral density (BMD) in humanized mice infected with HTLV-1 and HTLV-1 ΔHBZ viruses 1 week, 3 weeks, and 5 weeks after infection (n = 4–6 bones per group). Error bars represent ± SEM. *P < 0.05; **P < 0.01; ***P < 0.001 (2-way ANOVA). (C) Representative 3-D reconstruction images of tibial trabecular bone in humanized mice infected with HTLV-1 and HTLV-1 ΔHBZ viruses 1, 3, and 5 weeks after infection. (D) Scatter plots of the correlation (as indicated by linear best fit curve) between trabecular bone density (as measured by either BV/TV or BMD) on the y axis vs. percentage of human CD4+ T cells in the peripheral blood of humanized mice infected with HTLV-1 and HTLV-1 ΔHBZ 3 weeks after infection (n = 6–8 bones per group). R value and P value (Pearson correlation coefficient test was adopted to determine statistically significant correlation between the 2 groups) is shown; ns, P > 0.05.

