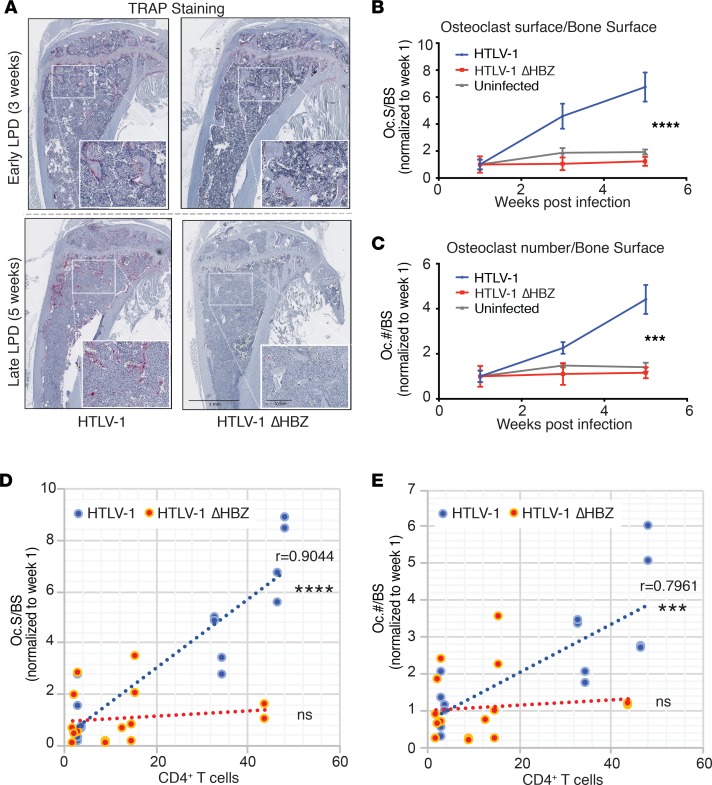
Figure 3. HTLV-1–infected humanized mice had increased osteoclast number in vivo.
(A) Histomorphometry of formalin-fixed, paraffin-embedded, decalcified tibia from humanized mice infected with HTLV-1 and HTLV-1 ΔHBZ virus showing tartrate resistant acid phosphatase (TRAP) staining at early-LPD (3 weeks after infection) and late-LPD (5 weeks after infection). Scale bars: 1 mm on both 10× magnification and 20× (inset) magnification. (B and C) Quantification of osteoclast surface per bone surface and osteoclast number per bone surface normalized to week 1 (n > 3 bones per group). Error bars represent ± SEM. ***P < 0.001; ****P < 0.0001 (2-way ANOVA comparing WT with ΔHBZ). (D and E) Scatter plots of the correlation (as indicated by linear best fit curve) between osteoclast surface/bone surface or osteoclast number/bone surface on the y axis vs. percentage of human CD4+ T cells in the peripheral blood. P value (Pearson correlation coefficient test was adopted to determine statistically significant correlation between the 2 groups) is shown; ns, P > 0.05.

