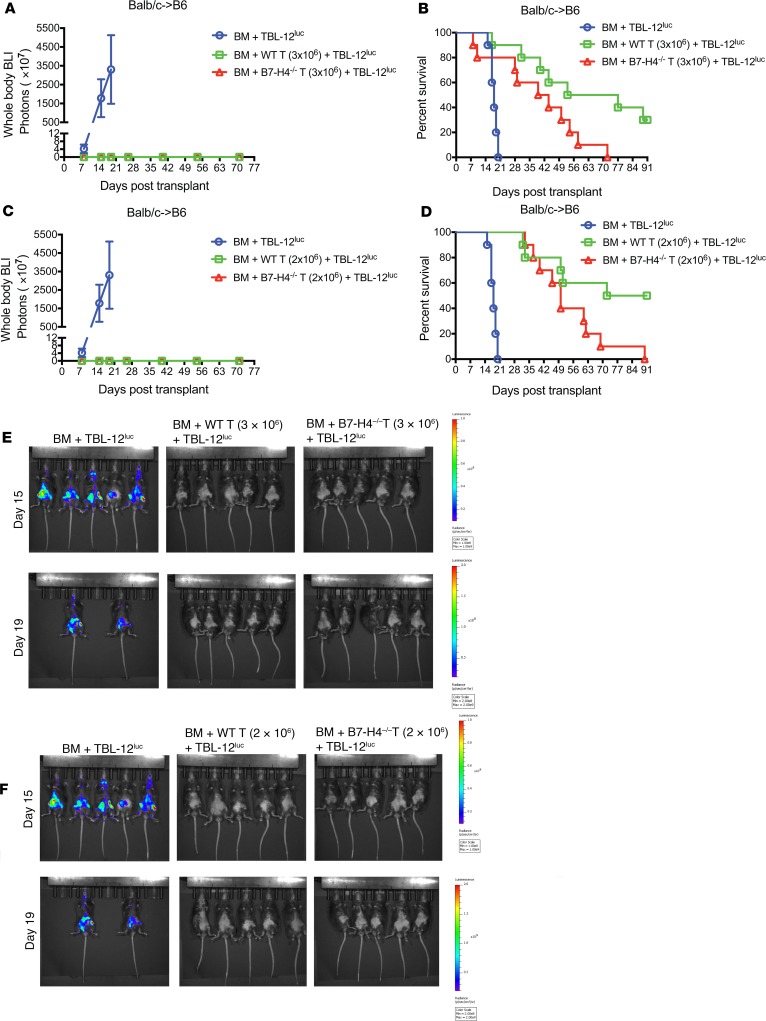
Figure 8. GVL effect is retained in recipients of WT versus B7-H4–/– donor T cells.
(A, B, and E) Lethally irradiated B6 recipients were infused with 107 T cell-depleted WT BALB/c BM cells plus 5 × 10³ TBL-12luc-lymphoma cells or lethally irradiated B6 recipients were infused with 107 T cell-depleted WT BALB/c BM cells plus 5 × 10³ TBL-12luc-lymphoma cells along with 3 × 10⁶ WT BALB/c or B7-H4–/– purified T cells on day 0 (n = 10 mice/group). (C, D, and F) Lethally irradiated B6 recipients were infused with 107 T cell-depleted WT BALB/c BM cells plus 5 × 10³ TBL-12luc-lymphoma cells or lethally irradiated B6 recipients were infused with 107 T cell-depleted WT BALB/c BM cells plus 5 × 10³ TBL-12luc-lymphoma cells along with 2 × 10⁶ WT BALB/c or B7-H4–/– purified T cells on day 0 (n = 10 mice/group). (A and C) Tumor growth was monitored by LUC imaging on day 8, day 15, day 19, day 26, day 40, day 54, and day 71 after BMT. BLI, bioluminescence imaging. (B) Kaplan-Meier survival plot of transplanted mice is shown (recipients of WT versus B7-H4–/– donor T cells, P = 0.0284). (D) Kaplan-Meier survival plot of transplanted mice is shown (recipients of WT versus B7-H4–/– donor T cells, P = 0.0258). (E and F) In vivo BLI of TBL-12luc-lymphoma cells on day 15 and day 19 after BMT. The scale to the right of the images describes the color map for the photon count. (B and D) P values were calculated by log-rank test. (A–F) Data were obtained from 1 experiment and same control transplanted mice (BM + TBL-12luc) were used in A, B, and E; and in C, D, and F.

