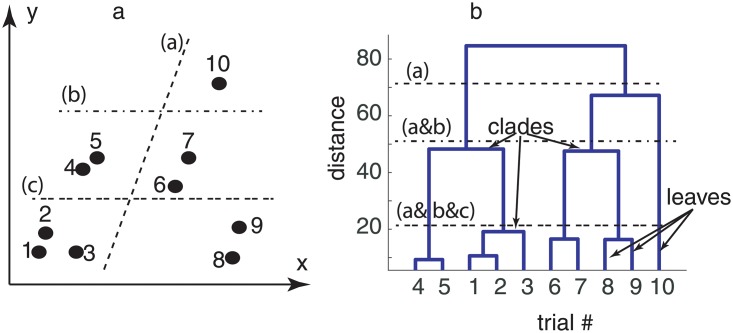
Fig 1. Dendrogram analysis.
Euclidian distance between scattered two-dimensional data (a) was used for assigning individual points to clusters based on their similarity as measured by the Euclidian distance between data points (b). The vertical axis of the dendrogram (b) gives the distance between different data points (leaves). The closest points #4 and #5 (see panel a) are clustered together in the dendrogram (panel b) with the lowest horizontal linkage (distance). A horizontal dashed line marked with (a) through the dendrogram (panel b) shows two clusters, which are identified in the actual data (panel a) by the corresponding dashed line. Lower maximum distances among data points split the data in three (dashed-dotted line marked with (b)) and five (double dashed line marked with (c)) clusters, respectively.

